It has now been 25 years since the start of strong growth in the Southeast Asian palm oil industry. Independent smallholders are crucial in the supply chain of large palm oil companies as they generate up to 40 percent of the global Fresh Fruit Bunch (FFB) supply. However, independent smallholders are facing declining yields per hectare as their trees are aging. In Indonesia, financial and land tenure hurdles prevent effective financing of replanting, raising the risk of increasing deforestation in Southeast Asia after a period of declining forest loss. This report evaluates the financial and other hurdles in Indonesia and investigates plans by governments and companies to offer solutions.
Download the PDF here: Future Smallholder Deforestation: Possible Palm Oil Risk
Download the Bahasa translated version here: Deforestasi oleh Petani Kecil di Masa Mendatang: Risiko yang Memungkinkan dari Kelapa Sawit
Key Findings:
- Independent smallholder deforestation may be a growing risk in the palm oil sector. Particularly in Indonesia, smallholders are confronted with aging trees and declining yields. In the next 25 years, USD 18 to 28 billion may be needed to renew independent smallholders’ plantations. Smallholders’ lack of access to resources is already leading to increased conversion of peat soils on Borneo Island.
- Government programs on SME financing and replanting stall due to lack of landownership titles. KUR (SME financing) and PSR (replanting) programs may cover potential costs for farmers, including replanting costs and loss of cash flow for 3-5 years. Due to lack of land ownership titles, only 5 percent of the 2018 target of 185,000 ha in PSR was met.
- Large palm oil companies’ incentive programs are relatively small, while direct bank loans are costly and risky. Palm oil companies offer technical support and financial programs, also related to KUR/PSR, but a program by Golden Agri-Resources covers just 2 percent of their independent smallholders. Direct bank loans are not attractive for farmers.
- The plantation mills of the top-10 listed palm oil leaders rely on Indonesian independent smallholders for 14 percent of total FFB supply. The most exposed are Astra Agro Lestari (37 percent), Bumitama (32 percent) and Indofood Agri (25 percent). They face operational risks from declining FFB supplies, while deforestation could lead to risks in market access and financing. Non-quantifiable derivative activities that source CPO from external suppliers have larger exposure to independent smallholders.
- Financial resources and remedies are available to mitigate smallholder deforestation risk. Annual renewal costs would total USD 1.1 billion. Subsidized and guaranteed loans would give support on land mapping and could lower net costs for obtaining land. Various stakeholders could provide financial, agro-technical, sustainability and (cooperative) management expertise.
Independent smallholders pose deforestation risk
Many large palm oil companies that produce CPO (crude palm oil) have two supply streams: production of FFB (Fresh Fruit Bunches) from their own concessions; and large amounts of FFB produced by smallholders. In general, there are two types of smallholders in the palm oil sector: plasma or tied farmers, and independent smallholders (small-scale farmers who are not linked to any particular company or mill).
While large oil palm growers increasingly comply with NDPE policies on their own concessions, deforestation may leak into their supply chains through forest conversion by smallholders. With this leakage, deforestation from independent smallholders can become an important contributor to total forest loss in a country. The deforestation mechanism for smallholders is determined by the old age of their trees and the lack of access to resources (see next section).
Deforestation by independent smallholders poses a financial risk to large palm oil companies. There are also risks for Indonesia for instance, whose goal it is to increase the sustainability standards in its most valuable industry, palm oil plantations.
NGOs and other stakeholders, increasingly aware of deforestation events by independent smallholders, have capability to link them to specific palm oil companies. As a consequence, large and often publicly-listed palm oil plantations could face the risk of losing revenues in the future due to non-compliance with NDPE commitments or RSPO certification. These companies may also lose financing and/or face higher financing costs. This dynamic would significantly affect the enterprise value and the equity value of these listed entities. Furthermore, the companies also face reputation risk.
Smallholders – backbone of palm oil market, but declining yields drive deforestation
Smallholders form the backbone of the palm oil market. In Malaysia, smallholders manage approximately 38 percent of oil palm plantations (equal to 2 million hectares). Most smallholders in Malaysia are plasma (60 percent of total smallholders’ plantation): farmers who develop a plantation in partnership with a large palm oil plantation that owns the concession.
In Indonesia, smallholders manage more than 40 percent of oil palm plantations (equal to 4.2 million hectares). Independent smallholders manage more than 3.1 million hectares, or about 74 percent of smallholders’ plantations. Researchers predict that the area of Indonesian smallholder plantations will continue to increase and account for around 60 percent Indonesia’s oil palm plantation area by 2030. The increase is mainly a result of continually increasing demand for palm oil, combined with the implementation of zero-deforestation commitments and the government moratorium on large-scale oil palm plantations expansion.
Productivity of smallholder plantations is commonly lower than large company plantations. The low productivity is mainly caused by poor quality of seedlings, inadequate application of fertilizers, or aging plantations.
Figure 1: FFB production volume by ownership type in Indonesia
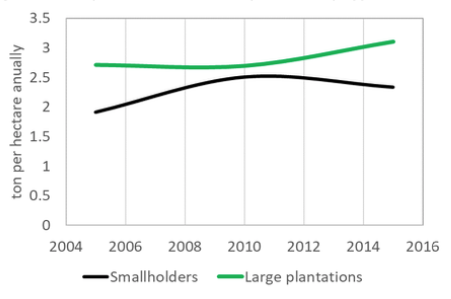
Note: This figure does not include the waiting period before production begins on new plantations and therefore does not provide accurate productivity levels. The figure is intended merely to show overall trends in productivity.
Source: Statistics Indonesia (BPS), 2016
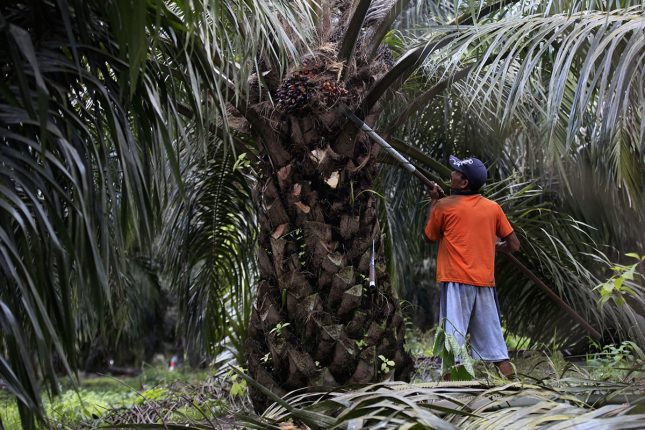
A study by research NGO CIFOR (2019) reported an increase in the conversion of peat soils in Borneo Island caused mainly by smallholder oil palm expansion. While tied/plasma smallholders receive financial support, farming advice and market access from large companies, independent smallholders often have limited resources at their disposal. Such constraints result in farmers lacking agricultural expertise and concerns over sustainability and lower productivity. Smaller yields reduce smallholders’ incomes and are therefore a major driver of expansion into forests and peatlands. To satisfy demand for palm oil without deforestation, smallholders need to replant and improve productivity on existing plots.
Replanting requires long-term investment but offers an investment opportunity for impact investors. Thousands of smallholders are currently managing old palm oil plantations, where productivity is declining. Farmers will not easily change their perennial species (except for rubber) because of soil conditions, regular cash flow streams from palm, and expertise. Replanting is becoming more urgent. Most farmers who do not have the capital to finance replanting will likely encroach into forested areas to supplement the lost income from declining yields. In 2017, Financial Access concluded that in the 2017-2041 period, around 175,000 ha of smallholder oil palm plantation in Indonesia need to be replanted every year. This replanting translates to a long-term financing need of USD 700 million per annum. In the 25 year-period, around USD 18 billion long-term investment would be needed to finance smallholder replanting. At the same time, the replanting provides a large investment opportunity for (impact) investors. They can use this opportunity to contribute to promoting sustainable development of the palm oil sector, as well as increased livelihoods for farmers.
Government programs to support smallholders partly fail amid lack of land titles
Indonesian and Malaysian governments have provided many subsidies and financing programs to support smallholder oil palm plantations. The Malaysian government allocated, in 2019, a RM 500 million fund (USD 119 million) to provide soft loans for smallholders with low interest rates of 2 percent annually for palm oil replanting. In Indonesia, smallholder financing has materialized through credits for Small and Medium Enterprises (KUR scheme, started in 2007), funded by commercial banks. The KUR (Kredit Usaha Rakyat) scheme provides a maximum loan of IDR 500 million per farmer (USD 34,440). Periods for the loans and the interest rates vary depending on the lender banks. The Indonesian Government subsidizes the interest payments for smallholders, holding them to a 7 percent annual rate. The KUR scheme is an ideal financing model for smallholders. However, only a small portion of independent smallholders managed to secure financing under the KUR scheme as they often cannot provide collateral required by the lender bank, such as a land certificate.
Furthermore, the Indonesian government provides a replanting fund (PSR Program) for smallholders with plantations that are smaller than four hectares. The program was supposed to help combat deforestation from plantation expansion and prevent recurring palm oil-related fire disasters. Smallholders who applied for this fund can receive a maximum of IDR 25 million/ha (USD 1,722). The cost of replanting (including infrastructure costs) is approximately IDR 50 – 60 million/ha (USD 3,460). Consequently, smallholders are required to secure other financial sources to fill the gaps, i.e. through the above-mentioned KUR scheme. However, distribution of the replanting fund has so far fallen short of its objective. Many smallholders were unable to provide a document of land ownership that is required to access the fund. Last year, the PSR program financed only around 5 percent of the initial 2018 goal of 185,000 hectares.
The monetary size of the PSR and KUR financing programs appears sufficient to cover the costs of a replanting process for a smallholder, including the loss of cash flow in the transition period. The largest cost item is the lack of cash flow for 3-5 years when hectares need to be replanted, which is 18X higher than the cost of new seeds.
Palm oil trees have a lifetime of circa 25 years. As independent smallholders are confronted with a large renewal phase for their palm oil trees, they face the following impacts on their cash flows:
- The replanting (seedling) costs of USD 482 per hectare.
- The loss of cash flow in the first three to five years before the new trees become productive. Cutting old trees causes a loss of ca 17 tons of FFB per hectare, translating into a loss of 3.6 ton of CPO per ha over a period of 3-5 years. With an assumption of USD 600 per ton CPO, the loss of cash flow per year for a smallholder is USD 2,170 per ha. This total translates to USD 8,681 per ha in a 3-5 year period (average four years). The loss of cash flow is 18X larger than the planting costs of USD 482 per hectare. Total costs are 9,163 per ha.
Thus, the KUR program with its maximum loan of USD 34,440 per farmer can cover nearly four hectares of palm oil tree renewal, including loss of cash flow. Including other additional financing from the PSR (planting) program, the potential monetary size of the government programs appears to not be the bottleneck for the replanting process. Instead, the bottleneck comes from the inability to provide land-ownership titles as collateral and farmers’ reluctance to take on large loans.
Large palm oil companies’ incentive programs are relatively small
Smallholders’ declining production and deteriorating FFB yield per hectare directly affect large palm oil companies’ profits. Therefore, these large companies develop various incentives or programs to help the independent smallholders replanting with the expectation to get better quality of FFB and higher volume of harvest that leads to better profitability.
The following list provides examples of incentives and programs initiated by large companies:
- Golden Agri-Resources (GAR) launched the Innovative Financing program for independent smallholders in Riau (2016). For the program, GAR is partnering with banks Syariah Mandiri and BRI Agro. Each farmer receives a compensation fee of IDR 500,000 per hectare (USD 34) each month to meet the needs of their everyday life for a period of approximately 48 months (the period until the replanted trees bear fruit). These farmers have also received the government fund from the PSR program. Currently, 320 smallholders managing approximately 900 hectares of plantations are involved in this program.
- In 2015, Musim Mas, in partnership with the International Finance Corporation (IFC), launched the “Indonesia Palm Oil Development Scheme for Smallholders” (IPODS). The program provides technical assistance to improve productivity of independent smallholders as well as assistance to get access to the PSR program and KUR scheme. About 9,652 smallholders receive technical assistance under this program.
- PT Perkebunan Nusantara XIII (PTPNXIII) initiated its “Oil Palm Replanting Program Independent Smallholder Farmers” (OPRPISF) scheme in West Kalimantan (2014). The program targets independent smallholders and aims to increase their plantation productivity and yields through replanting. It provides agricultural advice and facilitates financing. PTPNXIII provides a guarantee for smallholders’ lending, with investment of USD 3,200/ha for replanting. BRI Agro provided the financing, with a repayment period of 10 years at an interest rate of 7 to 12.5 percent. Approximately 15,000 hectares of smallholder plantations receive technical assistance from this program.
With GAR’s own mills being supplied by approximately 54,000 hectares from independent smallholders (see appendix), the 900 hectares in its program represents only 1.6 percent. For the other two, the lack of data impedes a good calculation. However, the percentages are probably higher.
Case studies on existing balance sheet impact from financing of independent smallholders
Despite sourcing substantial FFB volumes from independent smallholders, the financial accounts of Astra Agro Lestari (AAL) Tbk PT, Golden Agri-Resources (GAR), Wilmar and Cargill offer no indication of long-term financial support, loans or guarantees to independent smallholders.
In its 2018 Annual report, AAL indicates that it has been collaborating with 74,860 palm oil smallholders. The company generates circa 37 percent of its own CPO production from the FFB supplies of independent smallholders and 15 percent from plasma farmers (see Figure 2 below). AAL says that in its partnership programs with the local communities, it assisted their efforts to improve their productivity. The company applied the following actions:
- Implementation of several programs, including providing training and guidance on good oil palm cultivation practices.
- The supply of fertilizers.
- Purchasing of community FFB by AAL, contracting transportation for FFB, and engaging private contractors for the construction of infrastructure and facilities at the plantations.
- AAL says it applies strict no-deforestation policies and requirements to all its suppliers.
It appears that AAL gives some long-term support to plasma plantations. However, there is no indication of financial support to independent smallholders. The company’s balance sheet shows an item Advances, which totaled IDR 182 billion (USD 13 million) at the end of 2018. Of this amount, 75 percent is an advance for inventory. As the company collaborates with 74,860 smallholders, the calculation comes to USD 174 per smallholder.
On December 31, 2018, AAL also recorded a non-current asset Plasma Plantations of IDR 868 billion (USD 62 million). This amount represents plasma plantations which are still in development or receivables of plasma plantations which have been handed over to plasma farmers. Part of this amount could include pre-financing of smallholders. Some subsidiaries have developed plasma plantations under the KKPA scheme.
GAR, Wilmar and Cargill also do not seem to provide large financial support to independent smallholders. For GAR, 8 percent of its FFB supply to its own CPO mills (thus excluding CPO purchase for the extensive derivative activities) comes from independent smallholders in Indonesia (see Figure 3). As mentioned above, GAR operates an Innovative Financing program. These supportive measures cannot be identified in the financial statements, which suggests that guarantees are relatively small and/or this loan is not due to GAR.
Wilmar has explored financing programs with international banks. However, these programs did not take off due to a mismatch in time periods and ticket sizes of loans. Currently, Wilmar gives no direct financial incentive to replant. It mainly requires the smallholders and external suppliers to be NDPE compliant. No long-term loans to independent smallholders can be identified on the balance sheet. Wilmar has capitalized plasma investments of USD 14 million end of 2018. The company provides technical assistance on agricultural practices to 30,000 ha under government-originated plasma schemes. It supports these plasma smallholders in initial financing for development and land preparation, as well as through the provision of planting materials such as seedlings, fertilizers and pest control.
Cargill indicates that reporting requirements are too complex. The company relies for 40 percent of FFB on plasma smallholders and offers no loans but only a purchase guarantee.
Direct financing by banks and other financial service providers is too costly and risky for banks
Direct financing to independent smallholders is often considered too risky and costly by financial service providers, because of the following challenges:
- Small ticket size and limited ability to mitigate associated risks.
- Lack of creditworthiness as smallholders often have difficulty providing collateral, and the lenders are not able to extend loans based solely on internal cash flow models.
- High credit risk during unproductive periods after replanting (a grace period of 3–5 years).
- Long loan terms in the range of 10–14 years (including grace period).
- Challenging loan delivery and monitoring, as independent smallholders are often geographically scattered in rural areas and not formally organized.
- Independent smallholders are often unable to fulfill compliance with sustainability criteria that are increasingly required by FSPs.
- Foreign FSPs have to implement a strict ratio of 20:80 between a borrower’s foreign currency denominated short-term assets and their liabilities (Bank Indonesia Regulation Number 16/21/PBI/2014). As a result, foreign FSPs and impact investors are at a disadvantage in providing financing to smallholders.
Large palm oil companies’ own CPO mills source 19 percent of FFB from smallholders
The 10 largest palm oil plantation companies source, for their own CPO mills, an estimated 19 percent of the FFBs from independent smallholders, mainly in Indonesia and Malaysia. The companies that source most from Indonesian independent smallholders are Astra Agro Lestari (AAL) (37 percent), Bumitama (32 percent) and Indofood Agri-Resources (25 percent). The top 10’s FFB sourcing from Indonesian independent smallholders’ FFB is 14 percent of total FFB. These numbers exclude CPO bought from third parties (see next section): third-party purchases for some companies (GAR, Wilmar) are much larger than those from their own mills on their own estates.
Figure 2: Data from companies and CRR’s calculation of needed FFB
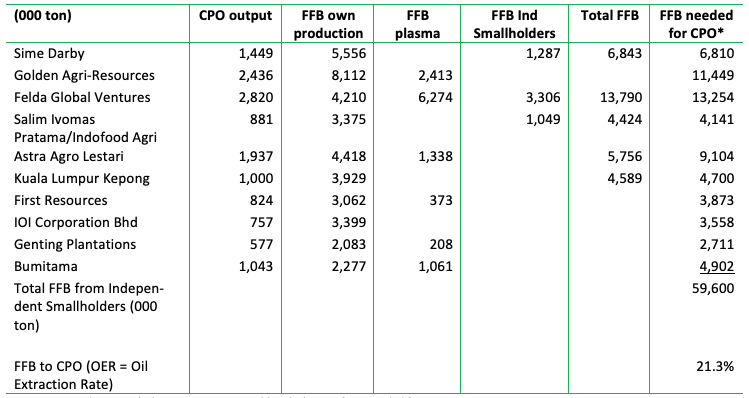
Source: Annual reports. * Chain Reaction Research’s calculation of FFB needed for CPO output
The world’s largest palm oil companies provide financial markets with data on their own CPO and FFB production. Reporting on FFB production is diverse and not consistent. All data in Figure 2 (see above), except the last column, are sourced from the companies’ annual reports. The last column is Chain Reaction Research’s calculation. From the CPO output number, the tons of FFBs needed are calculated based on an Oil Extraction Rate (OER) of 21.3 percent, an average used in this report. This FFB calculation is an input for Figure 3.
By deducting from the column “FFB needed for CPO”, which is the available data given by the companies, CRR calculated the tons of FFB sourced from independent smallholders (see Figure 3; only for own CPO mills).
In Figure 3, CRR calculated the exposure of own CPO mills to smallholders in Indonesia. Felda Global Ventures (FGV) and IOI lack a sizeable exposure to Indonesia, with respectively 7 percent and 11 percent of FFB supply. All others are highly exposed to Indonesia. By combining the exposure to independent smallholders FFB and the exposure to Indonesia, CRR estimated the size of exposure to independent smallholders in Indonesia:
- Astra Agro Lestari (37 percent FFB comes from Indonesian independent smallholders).
- Bumitama (32 percent).
- Indofood Agri-Resources (25 percent).
FGV (2 percent) and IOI (0 percent) have a low exposure. First Resources (11 percent), Kuala Lumpur Kepong/KLK (8 percent), GAR (8 percent), Genting (7 percent) and Sime Darby (6 percent) have limited exposure.
Figure 3: The exposure of the top-10 palm oil companies to Indonesian smallholders
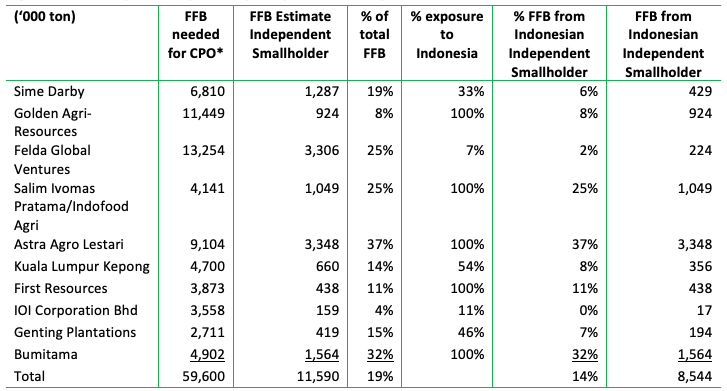
Source: Chain Reaction Research’s estimates based on Annual reports. * Chain Reaction Research’s calculation of FFB needed for CPO output
Figures 2 and 3 are based on reported data on produced CPO. As mentioned above, the list does not include activities outside the CPO produced in the companies’ own facilities. The list excludes Wilmar, which is a large conglomerate in trading/processing. Wilmar does not provide the transparency on CPO from own mills necessary to calculate the exposure to independent smallholders from that part of its business.
Large palm oil companies source substantially from smallholders through refining and derivative activities
The majority of revenue and sourcing of Sime Darby, Golden Agri-Resources, Kuala Lumpur Kepong, IOI and Wilmar originate outside their own CPO mills (see Figure 4). The large palm oil companies’ refineries source CPO internally as well as externally, while the derivative (oleochemical) activities source refined products also from other refineries. This structure means indirect exposure to independent smallholders is much larger than Figure 3 suggests. Although large companies provide a supplier list of the third-party mills, FFB volumes from independent smallholders through this channel is unknown. Examples include:
- Golden Agri-Resources (GAR) sources from 44 own mills. However, for its derivative business, it sources from 400 third-party mills. This derivative and other businesses generate 80 percent of GAR’s net revenues (Figure 4).
- Wilmar provides a number of own mills (45) and says 53 percent of FFB processed in own mills is supplied by independent smallholders. In Indonesia and Malaysia alone, 850 mills supply Wilmar’s refineries.
The refineries and the derivative activities have a large exposure to independent smallholders through sourcing from external parties. This dynamic explains the difference between the 19 percent exposure of the top-10’s own mills to independent smallholders and the 40 percent share of all FFB produced in Southeast Asia by independent smallholders.
Figure 4: Percentage of total net revenues to be related to own CPO production (2018)
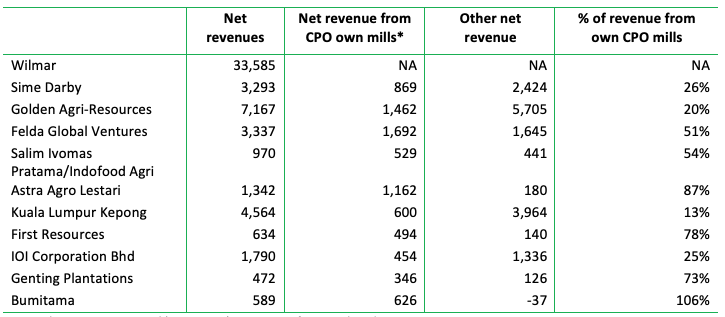
Source: Chain Reaction Research’s estimates; *net revenues from CPO based on USD 600 per ton
Remedies to prevent deforestation risk from smallholders: Involvement of all stakeholders
A CIFOR study (2017) put forward the following key conditions that enable innovative smallholder financing models to encourage sustainable production. With these key conditions, all stakeholders such as NGOs, government, companies, and FSPs (banks, other financers) could participate:
- Support and incentive to meet sustainability requirements. More and more FSPs are applying sustainability criteria to their financing. To include smallholders in their financial portfolio, smallholders will need technical assistance on good agricultural practices, RSPO certification, and deforestation-free production.
- Land tenure security. Governments could simplify procedures and reduce the costs in obtaining land. Large companies and local NGOs could provide assistance in land mapping exercises. FSPs, meanwhile, could accept a more flexible range of collateral and offer repayment terms that meet smallholder needs.
- Market linkages between smallholders and mills. A direct link between smallholders and mills or cooperatives (cut off the middleman/trader) is crucial for smallholders to see strong FFB prices. A transparent process in the grading and weighing of FFBs would provide greater incentives for smallholders and strengthen their position in negotiating prices.
- Supporting FSPs to assess and manage risks. Access to farm-level financial and production data is needed to assess the bankability of smallholders, understand credit risks, and support lending decisions. Tailored mechanisms are needed to support FSPs in efficient large-scale collection and analysis of smallholder farm data. Financial Access’ Credit Risk Scoring tool estimates the impact of 25 financial, household and production variables on smallholder cash flows. The tool allows FSPs to better understand risks and select the best performing farmers with the lowest credit risks.
- Strong and effective smallholder organizations. Creating organizations is achievable by strengthening existing cooperatives or supporting farmers in establishing new structures and management systems. Support mechanisms can strengthen the cooperatives and address issues, e.g. mismanagement, weak leadership, lack of funds, limited administrative capacity, corruption, etc.
As indicated above, the top-10 large palm oil companies have large exposure to independent smallholders outside their own mills, through their refineries and derivative business. This group could be included in determining solutions and potentially financing schemes for the relevant stakeholders.
Financial risks for large palm oil companies from deforestation by independent smallholders
Financial resources for replanting and covering cash flow loss for a 3-5 year period are available, but the main risk is in the execution of the remedies proposed by CIFOR. Large palm oil companies face operational risks in their supply chain due to declining yields from independent smallholders. This dynamic may result in increasing deforestation, leading to revenue and financing risks.
The planting costs and loss of cash flow add up to USD 9,163 per hectare (see a section above and also Figure 6 in the appendix). Independent smallholders which supply the top-10 palm oil companies’ own CPO mills would need to spend in total USD 4.6 billion for the upcoming renewal of trees (USD 242 million) and loss of cash flow (USD 4.4 billion). They own an estimated 503,000 ha of land (see Figure 5 appendix). This area may be up for tree renewal in the next 25 years. The USD 4.6 billion translates to USD 0.2 billion per year if it is spread out over these 25 years. With a total 2018 EBITDA of USD 3.4 billion for the top-10 (see appendix Figure 6), the USD 0.2 billion would mean 5.4 percent versus the total 2018 EBITDA for the top-10. As percentage of the top-10 companies’ market cap, the total renewal cost is 15.5 percent. For Astra Agro Lestari, Bumitama and Indofood Agri-Resources, however, the relative numbers would create a financially risky situation. The net-debt/EBITDA multiple 2018 and pro-forma 2018 leads to the same conclusion (not included in the appendix): problems for the three companies, but the net-debt/EBITDA ratio for the top-10 would move from 2.6X to pro-forma 4.0X.
The top-10 largest plantation companies’ own hectares represent circa 17 percent of the global planted palm oil area (appendix, Figure 7). For the whole industry, the USD 9,163 per hectare would total USD 28 billion for the 3.1 million independent smallholders’ hectares in the upcoming 25 years (Financial Access calculated USD 17.5 billion; see earlier section). The amount needed would total USD 1.1 billion per year. Available funds are sufficient to cover these costs. In 2016, the KUR program in Indonesia, which is focused on small and medium-sized companies, had USD 5.6 billion. Palm oil plantations had only partly used the program. In 2018, only 5 percent of the PSR goal had been reached.
Per individual farmer, the monetary size of funds and potential financing by banks and other FSPs per farmer do not appear to be the bottleneck for the renewal.
In fact, the availability of funds, or the potential contribution to (partially) funding the replanting process, is not the main financial risk for the 10 largest palm oil companies. The main risks are in not being able to successfully implement the solutions. Setbacks could result in declining supply of FFB to and lower production of CPO at the top-10 companies and/or deforestation by independent smallholders. Shareholders of the three companies with the largest direct sourcing from Indonesian independent smallholders (Astra Agro Lestari, Bumitama and Indofood Agri-Resources) could face:
- Operational risk. With limited support for independent smallholders to renew their trees, FFB supply to large palm oil companies may come under pressure, which would undermine net revenue and EBITDA.
- Revenues-at-risk. High exposure of these three companies to Indonesian independent smallholders raises the risk that deforestation is in their supply chains.
- Higher financing costs. Lenders could become more critical, while shareholders could divest or start lengthy engagement campaigns, all leading to a higher cost of capital.
In a broader context, financiers may start to engage with all large palm oil companies in order to implement solutions also outside own CPO mills. Thus, entire supply chains of the large palm oil companies’ refineries and derivative business could not only be required to be NDPE compliant; they could also be offered legal, financial, and technical support and expertise related to the solutions.
Appendix: Additional financials
This appendix contains figures that are based on Figure 2 and Figure 3.
- Calculations are made for the total replanting costs and the loss of cash flow in a four-year period (Figure 5).
- In Figure 6, the total renewal costs (replanting + cash flow loss) for the upcoming 25-year period is related to the EBITDA of 2018 and the market capitalization at 30 September 2019.
Figure 5: The estimated costs of planting and loss of cash flow for the top-10 palm oil companies in a 25 year-period
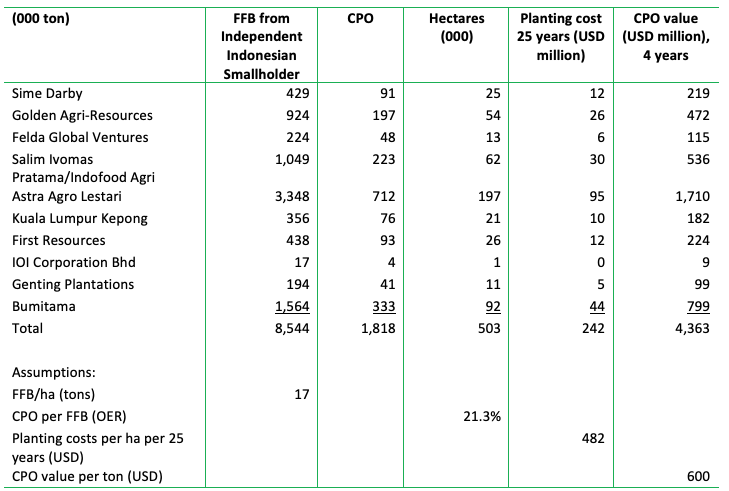
Source: Chain Reaction Research’s estimates, partly based on Annual reports and average multiples
Figure 6: The estimated total renewal costs for the top-10 palm oil companies versus EBITDA 2018 and market capitalization
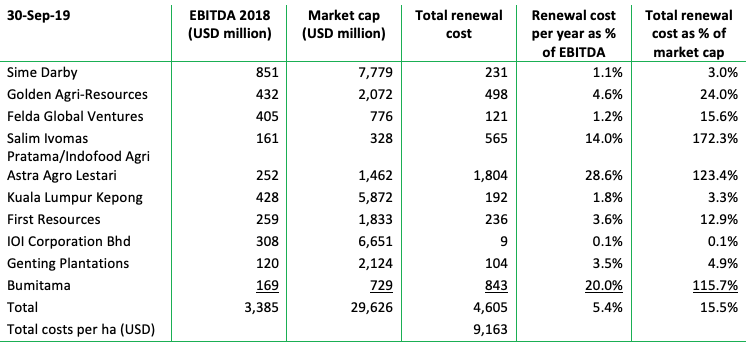
Source: Chain Reaction Research’s estimates, Bloomberg
Figure 7: Hectares of own plantations of the top-11 palm oil companies 2018
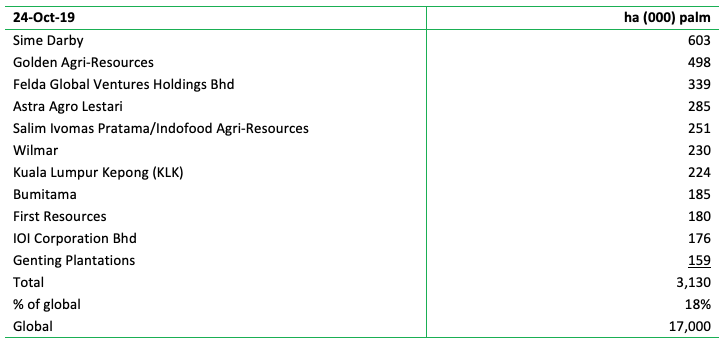
Source: Annual reports, Sipef, GAR