A large majority of global palm oil traders and refiners have implemented No Deforestation, No Peat, No Exploitation (NDPE) sourcing policies in recent years. Violations of such policies have repeatedly led to suspensions of oil palm growers from supply chains. Four years after the first suspension events, data is available on both short- and long-term impacts on the performance of affected growers. This report investigates how 15 suspensions as a result of NDPE non-compliance impacted the financial performance of four oil palm growers: Sawit Sumbermas Sarana (SSMS), Austindo Nusantara Jaya (ANJ), Tunas Baru Lampung (TBLA), and Indofood Agri Resources.
Download the PDF here: Palm Oil Growers Suspended Over Deforestation Lose USD 1.1B in Equity Value
Download the Bahasa translated version here: Perusahaan Perkebunan Kelapa Sawit yang Dibekukan karena Deforestasi Kehilangan Nilai Ekuitas Sebesar 1,1 Miliar Dollar AS
Key Findings:
- Since 2017, the “leakage market” has shrunk as several refiners have adopted new NDPE policies. These refiners have suspended non-compliant suppliers. As a result, market options for NDPE non-compliant actors have become more limited.
- Annual net profits of the suspended growers declined by USD 122 million (69 percent) since the first suspension events in 2015. SSMS, ANJ, TBLA, and Indofood Agri experienced reductions of USD 8-50 million in quarterly revenues, gross profit, EBITDA, and net profit per company. On their balance sheets, the growers saw higher receivables, inventories, and net debt. Growers that rely on third-party sales (SSMS, ANJ) seem to be more susceptible than growers that can sell to related parties (TBLA, Indofood Agri).
- Equity values of the four growers declined by a combined USD 1.1 billion since 2015. This amount equals 42 percent of the total equity value. On average, these companies performed weaker than benchmark indexes.
- More recent suspensions have caused greater declines in share prices. After the first suspensions in 2015, negative financial impacts and value deteriorations accelerated in the following years. This is likely due to the shrinking leakage market and the decreasing number of replacement buyers accessible to non-compliant growers. Future suspensions are expected to have greater adverse impacts on key financials.
Supply chain suspensions a frequent occurrence as market for unsustainable palm oil is shrinking
No Deforestation, No Peat, No exploitation (NDPE) policies have become a mainstay in the palm oil supply chain. Since the first such policy was adopted in 2013, the large majority of traders and refiners have adopted responsible sourcing policies, requiring their suppliers to refrain from deforestation, peatland clearing, or violations of human and worker rights. In 2017, Chain Reaction Research (CRR) estimated that 74 percent of Malaysia’s and Indonesia’s refining capacity was covered by an NDPE policy.
The remaining 26 percent constituted the “leakage market.” Companies that continued to source crude palm oil (CPO) without any sustainability requirements controlled these leakage facilities. However, since 2017, several large leakage actors have adopted their own NDPE policies. These actors include companies with significant refining capacity, namely Intercontinental Specialty Fats (ISF), IFFCO, Pacific Inter-Link, and Fuji Oil. As a result, the leakage market has shrunk significantly in the last two years, further limiting market options for NDPE non-compliant actors.
A fundamental element of most NDPE policies is that non-compliance may result in suspension of purchases. Company-level grievance mechanisms often identify suspension as the final outcome of unsuccessful supplier engagement processes. Since December 2018, several companies have adopted a “suspend then engage” approach. In this case, confirmed proof of deforestation or peatland development results in immediate suspension, while engagement takes place on the basis of pre-determined re-entry criteria.
Supply chain suspensions are implemented on a company group level. Non-compliant suppliers may therefore see all their products blocked, including oil palm from plantations without sustainability issues. Suspensions can function as an economic deterrent against unsustainable practices. Since large traders first barred suppliers in 2015, “suspension events” have occurred with accelerating frequency (Figure 1).
However, with the continued presence of a leakage market, the effectiveness of suspensions as an economic deterrent is often questioned. If non-compliant suppliers find a viable replacement market with “leakage refiners,” suspensions may function to clean specific supply chains but not work as an effective mechanism for behavioral change.
In the following analysis, CRR evaluates financial impacts of 15 suspension events involving four listed Indonesian palm oil growers:
- Sawit Sumbermas Sarana (SSMS)
- Austindo Nusantara Jaya (ANJ)
- Tunas Baru Lampung (TBLA)
- Indofood Agri Resources (IFAR).
Figure 1: Timeline of analyzed suspension events
The report analyzes the impact of suspension events on key, comparable financial metrics of the four palm oil growers. Metrics include net revenues, gross profit, EBITDA, net profit, receivables, market cap, and net debt. The underlying methodology and a full overview of metrics and their relevance is included in the appendix at the end of the report.
Sawit Sumbermas Sarana (SSMS) – Repeated suspension events lead to equity value loss
PT Sawit Sumbermas Sarana (SSMS) is a midsize Indonesian palm oil company that has been listed on the Indonesian Stock Exchange since December 2013. SSMS is controlled through parent company Citra Borneo Indah Group (CBI). Through seven concession companies, it operates 96,540 hectares (ha) on 19 oil palm estates in Central Kalimantan. It also operates nine palm oil mills. A total of 73 percent of their concession areas has been planted.
In 2015, SSMS was the subject of NGO reports and a complaint filed with the Roundtable for Sustainable Palm Oil (RSPO). Allegations centered on clearing of forested peatlands and orangutan habitat. They also noted flawed High Conservation Value (HCV) assessments and the lack of Free Prior and Informed Consent (FPIC) at SSMS’ subsidiaries PT Kalimantan Sawit Abadi (PT KSA) and PT Sawit Mandiri Lestari (PT SML). PT SML was spun off to a related entity in 2016, after which the RSPO closed the complaint. Deforestation at PT SML continued in 2017 and 2018.
In 2015, SSMS was subject to the first string of supply chain suspensions. Wilmar reported several rounds of engagement with SSMS did not resolve the case and it has halted purchases from SSMS from June 2015 onward. Golden Agri-Resources (GAR) deemed SSMS to be non-compliant with its NDPE policy in August 2015. Apical’s grievance list indicates that it is monitoring the case, while SSMS’s quarterly statements suggest that Apical ceased purchases after 2Q15. Combined, Wilmar, GAR, and Apical accounted for 58 percent of SSMS’s quarterly revenues in 2Q15 (Figure 2).
Unilever had been a replacement buyer of SSMS products until it found that SSMS was not in full compliance with its Sustainable Palm Oil Policy. Unilver suspended sourcing from June 2017 onwards. PT Synergy Oil Nusantara (PT SON), an IFFCO subsidiary, stepped in as another important replacement buyer for SSMS. IFFCO put sourcing from SSMS on hold in June 2018, in response to receiving alerts from buyers and financial institutions. IFFCO is continuing its dialogue with SSMS to find an amicable resolution. IFFCO accounted for 20 percent of SSMS’ revenues at the time of suspension.
Figure 2: Sawit Sumbermas Sarana (SSMS) – Suspension events
Source: Company sources; Chain Reaction Research.
Impact of suspensions on SSMS’s key financials
- SSMS’s key financial numbers show that the suspensions had material impact on net revenues, gross profit, and net profit, particularly in 2015.
- In 2Q15-3Q15, gross profit and net profit deteriorated by about USD 30 million in a two-quarter period.
- Moreover, receivables showed a strong increase and inventories rose. Consequently, net debt deteriorated.
- In 2015-2018, when the suspensions occurred, net profit declined by USD 51 million and equity value deteriorated by 35 percent, or USD 451 million.
The impact of the 2Q15 suspension on revenues was substantial (Figure 3). In 2Q15 and 3Q15, SSMS’ revenues started to decline by respectively 13 and 18 percent year-on-year (YoY), after growing by 14 percent YoY in 1Q15. From 1Q15 to 3Q15, net revenues declined 33 percent or IDR 230 billion (USD 16 million). This difference is significant, although it is less than the 58 percent combined revenue share generated by SSMS’s three big suspension customers. Gross profit showed a strong YoY decline in 2Q15. In absolute terms, it decreased further in 3Q15. SSMS lost circa IDR 217 billion, or USD 16 million, in gross profit in 2Q-3Q15. Net profit deteriorated by IDR 212 billion (USD 15 million) from 1Q15 to 3Q15.
In the balance sheet items, receivables and inventories increased by IDR 124 billion (USD 9 million).
Unilever’s suspension in 2Q17 was a relatively small event, and the impact on revenues and gross profits was less material. Similarly, impact on receivables and inventories as percentage of net revenues was also limited. Short-term loans to related parties increased sharply, the main reason for the increase in net debt.
IFFCO generated 20 percent of SSMS’ revenues in 2Q18, but financial impact of the suspension did not become visible until 4Q18-1Q19. In 2Q18-3Q18, BARI Pte became a large replacement buyer, and PT Citra Borneo Utama doubled its sourcing in 3Q18 versus 1H18. Between 2Q18 and 4Q18, revenues declined by IDR 252 billion (USD 18 million) on a quarterly basis. Net profit declined by IDR 453 billion (USD 21 million), also due to higher selling expenses.
Figure 3: Sawit Sumbermas Sarana (SSMS) – Financial impact on quarterly earnings
Source: Quarterly reports SSMS; Chain Reaction Research.
From the time of the first suspension events, SSMS’ share price experienced a decline. From 2017 onwards, SSMS’ share price underperformed versus the relevant benchmark indices (Figure 4 and 5).
Figure 4: Sawit Sumbermas Sarana (SSMS) – share price in suspension periods
Source: ThomsonEikon.
Figure 5: Sawit Sumbermas Sarana (SSMS) – share price development vs. JKAGRI, 2015-2017
Source: ThomsonEikon
After the first suspensions in 2015, SSMS experienced strong margin pressure in gross profit and EBITDA, weakening the share price by 49 percent. SSMS’s net revenues continued to grow after a dip in 2015 (Figure 6). The ratio receivables/net revenues increased by four percentage points, with a strong increase particularly in 2015-2016. Net debt increased sharply, while the market cap declined by USD 516 million from 2015 through the end of 2018. From the period of the first suspension in 2Q15 through the end of July 2019, the share price fell by 49 percent.
Figure 6: Sawit Sumbermas Sarana (SSMS) – Annual key financials
Source: Bloomberg; Chain Reaction Research; n/a = not available.
PT SML was sold for a much lower multiple than the price-to-book value of SSMS as a whole. The company’s Annual Report 2015 indicates that the price realized on the sale of PT SML was IDR 6.7 billion above the net book value of IDR 144 billion (AR15, page 23). Although profit is about USD 0.5 million, the price-to-book value of the whole company SSMS was 6.2x at the end of 2015. The Annual Report 2015 indicates that the price realized on the sale of PT SML was IDR 6.7 billion above the net book value of IDR 144 billion (AR15, page 23). Although profit is about USD 0.5 million, the price-to-book value of the whole company SSMS was 6.2x at the end of 2015.
The string of suspensions had a material impact on the company. After the start of the suspensions in 2015, gross profit growth stalled, while EBITDA and net profit declined materially (Figure 7). A decline of USD 19 million in EBITDA and USD 51 million of net profit resulted in an equity value decline of USD 450 million.
Zooming in on the period before versus the period after the first suspensions, trends indicate that the string of suspensions had a material impact on the company. After the start of the suspensions in 2015, gross profit growth stalled, while EBITDA and net profit declined materially (Figure 6). A decline of USD 19 million in EBITDA and USD 51 million of net profit resulted in an equity value decline of USD 450 million.
Figure 7: Sawit Sumbermas Sarana (SSMS) – Total change in 2011-2014 and 2015-2018
Source: Chain Reaction Research; n/a = not available as SSMS was not listed in 2011.
Austindo Nusantara Jaya (ANJ) – Suspension by replacement buyer had material impact on net revenues and net profit
Austindo Nusantara Jaya Tbk (ANJ) is an Indonesian listed palm oil producer, with plantations and CPO mills in Sumatra, Belitung, West-Kalimantan, and West Papua. It holds a total landbank of 169,816 ha, of which 81,817 ha are forests or peatland. ANJ considers approximately 35,000 ha of its undeveloped land as plantable. The majority of its undeveloped landbank is located in three contiguous areas in South Sorong and Maybrat, West Papua. Here, the company has a planted area of 8,619 ha and is in the process of constructing a CPO mill. The remainder of its 91,209 ha landbank in West Papua contains high forest cover.
ANJ has intermittently deforested on its concessions in West Papua, leading to supply chain suspensions since 2015 (Figure 8). Between January 2014 and March 2015, ANJ cleared intact forest landscapes on its PT Putra Manunggal Perkasa (PT PMP) and PT Permata Putera Mandiri (PT PPM) concessions. This action violated newly adopted NDPE policies of several of ANJ’s customers. Wilmar suspended ANJ purchases in April 2015, pending resolution of the matter to Wilmar’s satisfaction. Golden Agri-Resources found ANJ to be non-compliant in May 2015 and suspended the company shortly afterwards. Musim Mas followed in August 2015. The company subsequently halted further plantation development in West Papua while reviewing its HCV assessments.
However, ANJ restarted deforesting in 2018. ANJ stated that it needed to clear a significant portion of its concession in order to operate an economically viable concession. As a result, IFFCO’s PT Synergy Oil Nusantara (PT SON) suspended ANJ in 2Q18. With a revenue share of 54 percent, PT SON had been ANJ’s most important replacement buyer after being excluded from the NDPE market.
Figure 8: Austindo Nusantara Jaya (ANJ) – Suspension events
Source: Company sources; Chain Reaction Research
Impact of suspensions on ANJ’s key financials
- ANJ’s financial key indicators show that the suspensions in 2015 and 2016 had material impact on net revenues (USD 8-14 million), gross profit (USD 5-16 million), and net profit. Moreover, net debt increased by tens of millions USD.
- Nevertheless, the share price mostly did not underperform versus benchmarks in the two quarters following the suspensions. This development might have been related to the low liquidity of the shares and dominance of two shareholders.
- The IFFCO suspension had a delayed impact, possibly due to contract obligations.
In the quarters after the suspensions, revenue declines were large (USD 8-14 million). In 3Q15, revenues fell by 24 percent, in 1Q16 by 26 percent and in 1Q17 by 28 percent (bold line in Figure 9 below). In both 1Q16 and 1Q17, gross profits also took a hit of USD 5-16 million. In selling expenses, no consistent upward move is visible. In total, net profit development after the suspensions was negative.
In 3Q15, ANJ saw high exceptional costs. Its Annual Report 2016 (page 68) indicates that in 2015, the group decided to slow its new planting process on the recently deforested plantations (PT PMP and PPM) and halted the new land clearing process after the first wave of suspensions. Following this decision, PT PMP and PPM cut their contactors’ activities. Incurred termination charges for land clearing contractors and seedlings purchase agreements amounted to USD 8.8 million.
In the balance sheet items, inventories slightly increased after the suspensions. The main sign of weaker performance was a substantial increase in net debt, with 1Q17 as an exception, when ANJ realized a book profit.
Figure 9: Austindo Nusantara Jaya (ANJ) – Financial impact on quarterly earnings 2015-2017 events
Source: Quarterly reports ANJ; Chain Reaction Research
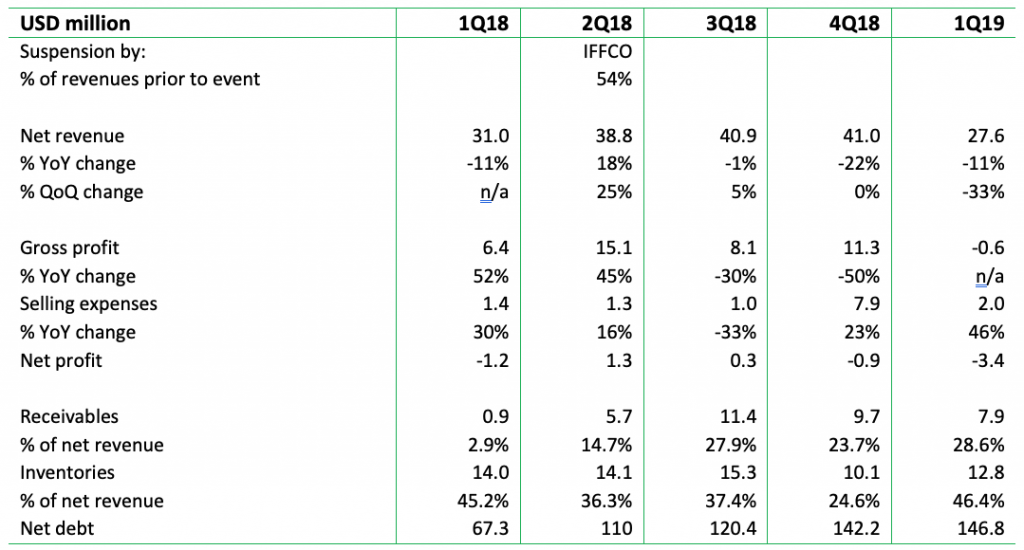
In 2Q18 through 3Q18, when IFFCO suspended ANJ, the company did not immediately see negative impact on revenues and gross profit, probably due to longer contracts. Larger changes in selling expenses and profitability occurred from 4Q18 onwards. IFFCO was a material customer with 54 percent of sales prior to the suspension but remained at 51 percent until 3Q18, likely due to contract obligations. Net profit remained low, between USD 0.3 million and 1.3 million (Figure 10). Net debt increased substantially, partly as a result of receivables. In 4Q18, gross profit was down 50 percent YoY and the selling expenses increased substantially by 23 percent YoY. In 1Q19, ANJ experienced material financial impacts. Domestic sales declined while exports sales rose substantially, most likely to India. Gross profit became negative. ANJ reported a 1Q19 net loss.
Figure 10: Austindo Nusantara Jaya (ANJ) – Financial impact on quarterly earnings IFFCO 2Q18 suspension
Source: Quarterly reports ANJ; Chain Reaction Research
ANJ’s share price outperformed benchmarks, for the most part, in the three quarters at the time of its suspension (except for the KLK suspension), despite the financial impacts indicated above (Figure 11 and 12). Investors may note that the stock’s liquidity is low and that 82 percent of ANJ’s shares are controlled by two shareholders.
Figure 11: Austindo Nusantara Jaya (ANJ) – share price in suspension periods
Source: Bloomberg; Chain Reaction Research
Figure 12: Austindo Nusantara Jaya (ANJ) – share price development vs. JKAGRI, 2015-2017
Source: ThomsonEikon
Looking at a broader time period, from 2015 to 2018, when the suspensions started, ANJ experienced a decline in net revenues, the gross margin, and EBITDA declined (Figure 13).
Figure 13: Austindo Nusantara Jaya (ANJ) – Annual key financials
Source: Bloomberg; Chain Reaction Research
When the period 2011-2018 is split into a period “before the suspension” and “since the suspension,” gross profit and EBITDA already declined sharply in 2011-2014, accelerating further in 2015-2018 (Figure 14).
Figure 14: Austindo Nusantara Jaya (ANJ) – Total change in 2011-2014 and 2015-2018
Source: Chain Reaction Research
Tunas Baru Lampung (TBLA) – Suspensions have longer term impacts on debt, profits and equity value
Tunas Baru Lampung (TBLA) is a vertically integrated palm oil and sugar cane company publicly listed on the Jakarta Stock Exchange since 2000. As of the end of FY2018, 44.7 percent of the company’s shares were publicly listed. TBLA is a member of the Sungai Budi Group, which is one of Indonesia’s largest manufacturers and distributers of agricultural consumer products. TBLA generates a significant portion of its revenues through related party transactions with the Sungai Budi Group.
TBLA’s oil palm landbank stands at 95,393 ha, located in South Sumatra and West Kalimantan. The company reports having 50,737 ha planted with oil palm. Besides its plantations, TBLA possesses three mills, two palm oil refineries, three processing facilities for soap and margarine and one biodiesel plant. A large part of its landbank is contested as a result of deforestation, peat conversion, and land conflicts.
Despite commitments to become RSPO certified for all its subsidiaries, TBLA has cleared almost 7,000 ha of peatland and forest since 2014. It has also been involved in four reported social conflicts. Peatland clearing at its subsidiary PT Dinamika Graha Sarana (PT DGS) in South Sumatra, deforestation at PT Solusi Jaya Perkasa (PT SJP) in West Kalimantan and at PT Samora Usaha Jaya (PT SUJ) in South Sumatra were in violation of its clients’ sourcing policies or Indonesia’s peatland moratorium.
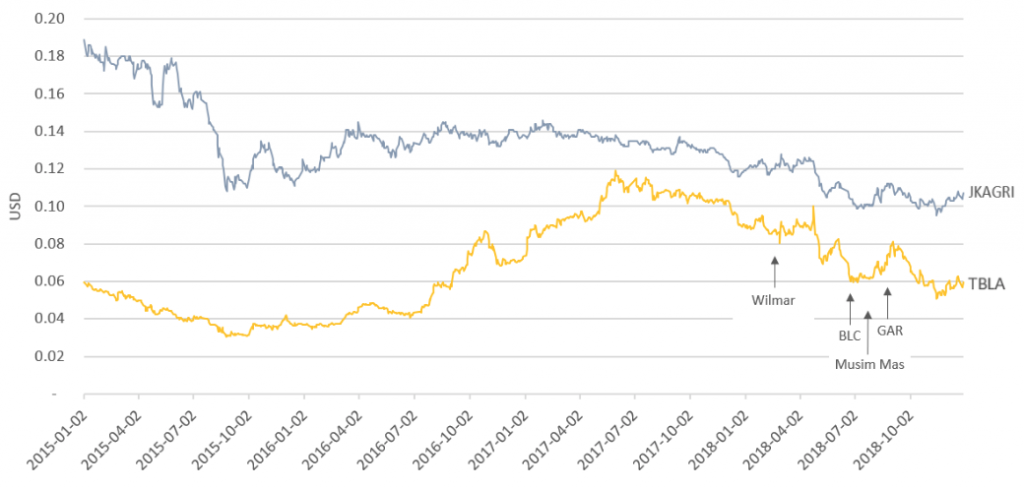
Several traders and refiners have engaged TBLA on the issues of deforestation and peatland clearing. In 2018, the engagements resulted in a number of suspensions, as TBLA continued to not comply with NDPE policies. Wilmar suspended purchases from TBLA in February 2018, as it detected ongoing land clearing activities after engaging TBLA on several occasions. BLC announced in June 2018 that it would no longer accept oil palm from TBLA. Musim Mas began engaging with TBLA in early 2017 in response to an earlier CRR report, applying “controlled purchase” on TBLA’s mills. In July 2018, Musim Mas stopped all sourcing (Figure 15). In August 2018, GAR stated that TBLA violated its grievance procedure and stopped purchases.
Figure 15: Tunas Baru Lampung – Suspensions by customers
Source: Company reports; Chain Reaction Research
TBLA has relied on two key costumers for most of its revenues: related party Sungai Budi and a Singaporean company, Inter-United Enterprises (IUE). None of the companies that accounted for more than 10 percent of TBLA’s revenues were involved in the suspensions.
Impact of suspensions on TBLA’s key financials
- On an annual basis, TBLA’s net revenues and profitability declined sharply in 2018, while net debt rose due to a strong increase in receivables. From 2011-2017, turnover and profits grew substantially.
- The share price underperformed strongly versus indices during the suspension periods.
- After the suspensions, TBLA’s market cap declined by USD 161 million in 2018.
In the quarters after the suspensions, revenues and gross profits were, on balance, negative. The net profit YoY growth rates deteriorated due to rising net debt and interest payments (Figure 16).
In 1H18, when Wilmar suspended TBLA, net revenues of the related party PT Sunga Budi increased from 40.4 percent to 42.1 percent of TBLA’s total. Because of PT Sunga Budi, TBLA’s net revenues and gross profit held up relatively well. However, due to rising inventories in absolute terms and a relative increase in trade receivables, free cash flow deteriorated, leading to higher debt and higher interest charges.
In 2H18, when GAR and Musim Mas suspended TBLA, declining revenues from third parties were offset by revenues from related parties. Net debt rose by IDR 3.08 billion (USD 220 million) between 4Q17 and 4Q18 due to lower earnings and weaker cash flows.
Figure 16: Tunas Baru Lampung (TBLA) – Financial impact on quarterly earnings
Source: Quarterly reports TBLA; Chain Reaction Research; n/a = not available
TBLA’s share price under-performed sharply in the quarters around its two suspension periods (Figure 17 and 18).
Figure 17: Tunas Baru Lampung (TBLA) – share price in suspension periods
Source: Bloomberg; Chain Reaction Research
Figure 18: Tunas Baru Lampung (TBLA) – share price development vs. JKAGRI, 2015-2017
Source: ThomsonEikon
In the broader time period 2011-2016, when no suspensions occurred, revenues, gross profit, EBITDA, and market cap were volatile (Figure 19). In 2017, TBLA had a strong year, reporting robust key financial figures. However, in 2018 (the year of the suspension) TBLA experienced negative growth rates in net revenues, gross profit, and market cap. Net debt rose considerably, in large part due to an increase in the receivables/net revenue ratio.
In 2018, sales to IUE, which accounted for 17 percent of revenues in 2017 and only 11 percent in 2018, declined by 14 percent in IDR, in line with the drop in the average palm oil price in IDR. However, revenues from the related party PT Sungai Budi (which remained a 40 percent client), fell by 3 percent. Volumes sold to PT Sungai Budi and other customers increased.
Figure 19: Tunas Baru Lampung (TBLA) – Annual key financials
Source: Bloomberg; Chain Reaction Research
In 2018, after the suspensions, TBLA’s revenues fell by USD 65 million, after rising by USD 245 million from 2011 to 2017 (Figure 20). At the same time, trends in gross profit and net profit turned negative, while growth in EBITDA decelerated. The company’s market cap increase during 2011-2017 nearly vanished in 2018. In March 2018, after the first suspensions, CRR calculated that revenue-at-risk (USD 69 million) related to NDPE commitments of customers could have a value impact (USD 116 million) equal to 24 percent of equity value.
Figure 20: Tunas Baru Lampung (TBLA) – Total change in 2011-2017 and 2018
Source: Chain Reaction Research
Indofood Agri Resources – Equity value drops by USD 304 million in 2017-2018
Singapore-listed Indofood Agri Resources (Indofood Agri) is one of the largest oil palm plantation companies in Indonesia. With its five palm oil refineries, it is also the domestic market leader for branded cooking oils, margarine and fats. Indofood has a total landbank of 549,287 ha, 26 palm oil mills, and five refineries in Indonesia. Indofood also has extensive rubber, sugar, tea, timber and cocoa plantations, as well as two sugar mills. Oil palm accounts for 83 percent of Indofood’s planted area.
Indofood has a long history of deforestation. A complaint was submitted to the RSPO in 2009 because of a land dispute on PT PP London Sumatra Indonesia Tbk in North Sumatra. Another complaint was filed in 2013 over the clearing of orangutan habitat on PT Gunta Samba Jaya in East Kalimantan. Further RSPO complaints followed, as well as numerous reports about Indofood’s forest and peat clearance and alleged human rights abuses. Indofood has also been the subject of long-standing NGO campaigns. In January 2019, Indofood Agri withdrew its membership from the RSPO.
After initial engagements, traders and refiners suspended Indofood Agri from 2017 onwards. In September 2015, Wilmar began engaging with Indofood, finally suspending purchases in June 2017 after almost two years of engagement (Figure 21). Musim Mas stopped purchases in August 2018 after two years of engagement. Bunge Loders Croklaan (BLC) did not buy directly from Indofood, but in 2018 it told third-party traders not to supply Indofood palm oil to its refineries. AAK, Cargill, Fuji Oil, and Golden Agri-Resources also dropped all business with Indofood.
Several consumer goods companies also severed ties with Indofood Agri. In most cases, these brands sourced from Indofood Agri indirectly. Direct supply chain suspensions also took place. In 2018, PepsiCo suspended palm oil purchases from Indofood Agri for its joint venture partnership with its parent company Indofood. Nestlé stopped buying from Indofood Agri in September 2018, as did Ferrero, General Mills, Hershey’s Kellogg’s, Mars, and Unilever.
Figure 21: Indofood Agri Resources – Suspension events
Source: Company reports; Chain Reaction Research
Impact of suspensions on Indofood Agri Resources’ key financials
- Key financial indicators of Indofood Agri Resources deteriorated sharply since the suspensions.
- Net revenues, gross profit, EBITDA, and net profit declined by material amounts, with net profit down USD 52 million on a quarterly basis.
- Moreover, receivables showed a strong relative increase while inventories increased. Consequently, net debt deteriorated by USD 163 million from 1Q17 to 2Q19.
The equity value deteriorated in 2017-2018 by USD 304 million.
Between 1Q17-2Q19, net revenues, gross profit, and EBITDA deteriorated quarterly, except for a recovery in 3Q18 (Figure 22). External sales declined, while revenues from related entities increased. These internal sales increased revenues through sales of margarine and cooking oils. Net debt increased by IDR 2.28 billion (USD 163 million), when including a relative increase in inventories and receivables (versus net turnover). These factors led to a net loss starting in 2Q18. The decline in net revenue totaled IDR 1.258 billion (USD 90 million) between 1Q17 and 2Q19. EBITDA declined by IDR 805 billion (USD 58 million) and net profit by IDR 722 billion (USD 52 million) on a quarterly basis. In 2Q19, lower revenues were the result of weaker prices and much lower volumes.
Figure 22: Indofood Agri Resources – Financial impact on quarterly earnings
Source: Quarterly reports TBLA; Chain Reaction Research
At the time of the suspensions, Indofood Agri Resources’ share price underperformed relative to benchmarks. In 2018, the share price decline was material (Figure 23 and 24).
Figure 23: Indofood Agri Resources – share price in suspension periods
Source: Bloomberg; Chain Reaction Research
Figure 24: Indofood Agri Resources – share price development vs. JKAGRI, 2015-2017
Source: ThomsonEikon
Based on annual numbers, Indofood Agri has faced large declines in net revenues, gross profit, and EBITDA. It also saw a very large decline in market cap since suspension events started in 2017. In 2017-2018, the equity value of the company declined by USD 304 million. The receivables/net revenues ratio showed a small increase until 2017 but rose by a higher amount in 2018 (Figure 25). Net debt rose as a result of weak profits and cash flows. Consequently, the ratio net debt/EBITDA has increased substantially to a high 7.8X.
Figure 25: Indofood Agri Resources – Annual key financials
Source: Bloomberg; Chain Reaction Research
In the period of the suspensions, all key financials declined. However, these declines were a continuation of the drop before the suspensions (Figure 26).
Figure 26: Indofood Agri Resources – Total change in 2011-2016 and 2016-2018
Source: Bloomberg; Chain Reaction Research
Suspensions had material effects on key financials indicators and value
- SSMS, ANJ, TBLA and Indofood Agri lost a combined equity value of USD 1.1 billion after their first suspensions. Combined net profits deteriorated by USD 122 million.
- The impacts are larger and more consistent for all four companies when focusing on an extended period of time after the suspensions, rather than only on the periods of the specific suspension events.
- This outcome is likely due to a further shrinkage of the leakage market in recent years.
Before the suspensions, key financial indicators showed high growth in net sales and EBITDA of respectively 19 percent and 25 percent, with stable profits on average (Figure 27).
Figure 27: Key financials in the years before suspensions – total growth over period*
*Cumulative growth
Source: Chain Reaction Research
Key financial indicators deteriorated materially from the moment that suspensions started. All key financials performed weaker than before the time of the suspensions. For instance, net revenues in the years before the suspensions grew by 19 percent for the four companies (unweighted average), while the decline was 1 percent in the period from the suspension start until end 2018. Only the trend in gross profit decline became slightly smaller, from -9 percent to -7 percent.
Market capitalization showed a significant decline of 39 percent on average from the start of suspensions, while this figure was only -6 percent before the suspensions (Figure 28).
Figure 28: Key financials in the years after the suspensions started until end 2018 – total growth
Source: Chain Reaction Research
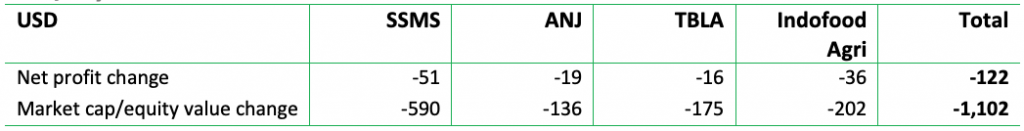
For each of the four companies, servicing the leakage market resulted in long-term declines in net profits and equity value. Net profit and equity value of the four companies declined in total by respectively USD 122 million and USD 1.1 billion (Figure 29). These reductions translated into a decline of 69 percent in net profit and 42 percent in equity value.
Figure 29: Net profit and equity value change when the suspension started until end 2018/July 2019*
Source: Chain Reaction Research; *equity value until 30 July 2019, net profit realized in 2018
In the nine-month period from the quarter before the suspension to the end of the quarter after the suspension, suspensions led to a -17 percent share price decline on average versus -16 percent for the JAKAGRI index in those periods.
On average, the share prices in the three quarters around the suspension declined by 17 percent (Figure 30). This declined was slightly below the -16 percent of the JAKAGRI index. TBLA and Indofood Agri showed relatively weak share price performances.
Figure 30: Share price development during the suspension quarters*
*From the first day of the quarter before the quarter of suspension to the last day in the quarter after the suspension. Source: Bloomberg; Chain Reaction Research
Figure 31 indicates that in the periods from the first suspension for each company until end of July 2019, share prices of the suspended companies declined on average by 42 percent versus a decline of 38 percent for the JAKAGRI index and an increase of 10 percent for the Jakarta index.
Figure 31: Share price development since the first suspension for each company until 30 July 2019*
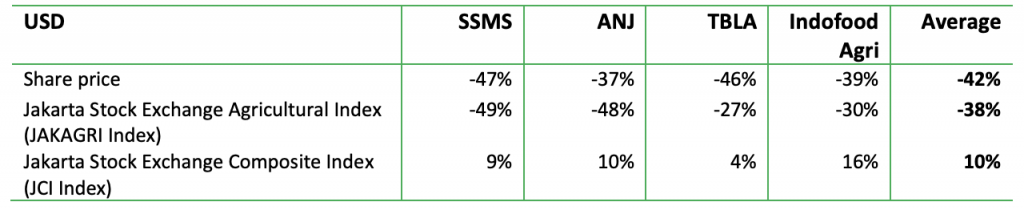
*From the first day of the quarter before the quarter of suspension until 30 July 2019. Source: Bloomberg; Chain Reaction Research
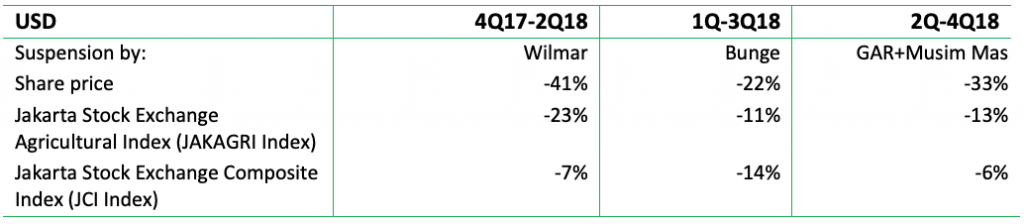
More recent suspensions have caused greater declines in share prices, likely due to the shrinking leakage market. The suspensions in the period 2017-2018 had a more material impact on the share price. During the three-quarter periods, the share prices of the four companies dropped by 20 percent on average, versus a 13 percent decrease of the JAKAGRI Index. The JCI Index dropped by 7 percent. The most likely explanation is that the leakage market is smaller. After the first suspensions in 2015, growers could still fairly easily access replacement markets. Such alternatives have become much scarcer since then. More traders/refiners have adopted NDPE policies in recent years, including traditional leakage actors such as IFFCO.
Appendix: Methodology and Metrics
In the analysis of a potential financial impact from being suspended by NDPE buyers, the focus is on the following key metrics in the profit & loss account and of the balance sheet of the palm oil growers:
- Net revenues. It is important to know how suspensions of sourcing related to NDPE or RSPO violations have affected the net revenues as volumes could have been affected. Pricing per ton could have declined as a result of selling palm oil in the leakage market. Volumes could also be affected as it would be more difficult to find a buyer.
- Gross profit and EBITDA development. The gross profit is the difference between selling price and costs of raw material and supplies from smallholders. This margin could be affected in case of volume reductions or sales into the leakage market. The EBITDA is the results after personnel and other expenses and therefore is more volatile as it is a result after less-flexible cost elements.
- Selling expenses. These could rise if a company is suspended and a company needs to find new clients.
- Net profit change. This is an important metric for every company, as it is a result after interest costs and tax. Higher interest costs can be the result of suspensions as balance sheet items will be affected.
- Development of receivables and inventories. As a consequence of the pressure of selling palm oil into the leakage market and the knowledge of this situation by the new (leakage) customers, these customers might decide to pay later. This would lead to a higher level of receivables on the asset side of the balance sheet. Consequently, net debt levels would increase. Suspension might also lead to higher inventories.
- Net debt. Higher receivables and inventories lead to a higher net debt.
- Stranded assets. The extra write-down of assets because market access risk or regulatory issues force the company to write-down certain assets. This might consist of investments related to concessions.
The key financial indicators are monitored in two ways:
- In a three-quarter period before, during and after the suspension. Through this measurement, the comparison between a ‘normal’ quarter (Q (t-1)) can be compared with two quarter when the suspensions might have affected the key metric, in Q (t) and Q (t+1).
- In a longer-term period 2011-2018. Suspensions by larger companies might lead other smaller buyers also to end sourcing from a plantation. These news facts might remain unknown. By comparing a period before the first suspension with the period existing of the year the first suspension until end 2018, a change in trends of key metrics might be observed.
The value of the companies is monitored through the market capitalization or the equity value:
- Equity value/market capitalization and share price development. The equity value development is a reflection of the expectation of future free cash flow development by a company. The relative share price development versus peers reflects how a suspended company has developed versus a benchmark which also includes non-suspended industry members.
- Also for the equity value, two time period are used. When looking to the quarterly effects, the share price of the first trading day of the preceding quarter of the suspension is compared to share price of the last trading day of the quarter after the suspension. This 90 days period might seem long, but captures the impact on the share price of discussions and market information before the suspension and the impact of news spread after the official publication of the suspension.
The methodology has limitations. For instance, merger, acquisitions and divestments, which are not investigated in this report, might impact the development of key metrics.