Summary
- Austindo Nusantara Jaya (ANJT:IJ): 2016 35% quarterly revenue at risk based on Q4 2015 actual revenue losses of 10% when ANJT did not meet buyers’ NDPE policy expectations.
- Sawit Sumbermas Sarana (SSMS:IJ): 2016 42% quarterly revenue at risk based on Q4 2015 actual revenue losses of 0% to 5% when SSMS did not meet buyers’ NDPE policy expectations.
- Provident Agro (PALM:IJ): 2016 37% quarterly revenue at risk based on Q4 2015 actual revenue losses of 15% when PALM did not meet buyers’ NDPE policy expectations.
As reported on Chain Reaction Research by Milena Levicharova, Gabriel Thoumi, CFA and Eric Wakker, As more and more palm oil traders and producers establish No Deforestation, No Peat, No Exploitation (NDPE) policies, palm oil growers that choose not to meet these standards have lost revenue and are putting potential future revenue at risk. Austindo Nusantara Jaya, Sawit Sumbermas Sarana, and Provident Argo are all growers that have not chosen to achieve buyer NPDE requirements, and as a result, each company is facing buyer turnover, loss, as well as an increasingly less diverse buyer base.
This report applies a Monte Carlo simulation technique to determine 2016 quarterly revenue at risk for three selected palm oil producers. The scenarios are based on a situation where each company has buyers that suspend purchases, from an undiversified buyer base, due to a failure to meet each buyer’s NDPE policies requirements. The scenario is based on actual revenue lost by these three companies in 2015 due to not meeting buyers’ NDPE policy requirements. After running 1,000 iterations, the analysis presents a 5% probability of revenue at risk (Appendix 1).
Key Findings
All three companies lost revenue due to non-compliance with buyers’ policies, failing either to identify the risk potential of their non-diversified buyer portfolio or to undertake timely action to mitigate, transfer or avoid it.
- Austindo Nusantara Jaya (ANJT:IJ): 2016 35% quarterly revenue at risk based on Q4 2015 actual revenue losses of 10% when ANJT did not meet buyers’ NDPE policy expectations.
- Sawit Sumbermas Sarana (SSMS:IJ): 2016 42% quarterly revenue at risk based on Q4 2015 actual revenue losses of 0% to 5% when SSMS did not meet buyers’ NDPE policy expectations.
- Provident Agro (PALM:IJ): 2016 37% quarterly revenue at risk based on Q4 2015 actual revenue losses of 15% when PALM did not meet buyers’ NDPE policy expectations.
For SSMS and PALM, their share prices declined as their revenue fell. For ANJT, its share price has not declined despite its fall in revenue.
The industry-wide trend toward NDPE policies began in 2013 with Wilmar International, followed by Golden Agri-Resources, Musim Mas, Apical, and eventually other key palm oil buyers. In doing so, the traders sent a clear signal that NDPE policy adoption and compliance would be a requirement for their upstream growers. The three growers profiled in this analysis could have forecasted the threat of reduced revenue, yet none satisfactorily adapted to their buyers’ NDPE policies.
Accordingly, this analysis presents ANJT, SSMS, and PALM as case studies, focusing on the development of each company’s revenue at risk exposure. The paper presents an analysis of their 2015 revenue losses as well as a Monte Carlo simulation of each firms’ forecasted 2016 revenue at risk, if these companies continue to maintain an undiversified buyer base and do not comply with their buyers’ NDPE policies.
Austindo Nusantara Jaya 2015 and 2016 quarterly revenue at risk
– Q4 2015: ANJT lost 10% quarterly revenue due to not achieving buyers’ NDPE policies
– 2016: Monte Carlo model forecasts 35% quarterly revenue at risk at a 5% probability if ANJT does not diversify its buyer base and meet buyers’ NDPE policies
ANJT is a food and renewable energy company. ANJT’s main lines of business are palm oil and sago palm production and processing, and geothermal and biogas power generation.
In 2015, ANJT lost three major buyers, failing to comply with their NDPE policies. Figure 1 below shows how this materialized in revenue loss. As of May 2015, both Golden Agri-Resources and Wilmar International suspended crude palm oil (CPO) purchases from ANJT because of active forest clear ance in the Bird’s Head Peninsula in West Papua by two of its subsidiaries, PT Putera Manunggal Perkasa (PT PMP) and PT Permata Putera Mandiri (PT PPM). In Q4 2015, Musim Mas followed suit and also suspended purchases from ANJT.
Figure 1 below illustrates ANJT’s revenue decline in Q3 2015 resulting from losing key buyers GAR and Wilmar. ANJT then sold its CPO to Musim Mas along with a number of smaller buyers, but in Q4 2015, Musim Mas also suspended ANJT. This left Synergy Oil Nusantara (a joint venture of Felda Global Ventures, Tabung Haji and IFFCO) now representing 80% of ANJT’s total sales. Due to ANJT’s non-diversified buyer base, losing buyers proved costly, demonstrated by revenue losses. ANJT also damaged its reputation as the company failed to deliver on its buyers’ requirements and needs.
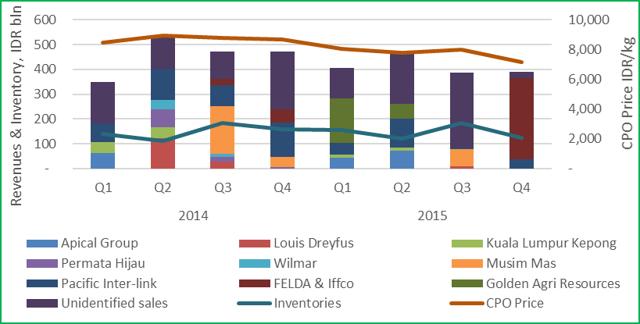
Figure 1: ANJT’s revenue, main buyers, and CPO price
In Figure 2 below, it is clear that ANJT’s buyer turnover depressed its quarterly and annual revenue. While ANJT’s CPO inventories increased in Q3 2015, its revenue decreased due to buyer NDPE policies.
| Metric | Changes YoY | % Change YoY | Change Q4 ’15 / Q4 ’14 | % Change
Q4 ’15 / Q4 ’14 |
| Revenue IDR million | (179,598) | -18% | (83,079) | -18% |
| CPO Price ANJ realized IDR/kg | (970) | -11% | (718) | -8% |
Figure 2: ANJT’s revenue changes
Figure 3 below demonstrates that ANJT’s buyer turnover also depressed its earnings margins. In Q4 2015, ANJT’s revenue loss and increased storage costs due to carrying higher inventory reduced operating and net income for the company, resulting in negative margins and return on equity. The quick ratio (current assets less inventories compared to current liabilities) as well as the current ratio (current assets to current liabilities) are now both half relative to historical average, lagging behind the industry median, suggesting potential liquidity difficulties for the company.
| Metric | Industry Median | ANJT’s Average | Q2 2015 | Q3 2015 | Q4 2015 |
| Operating Margin | 10.9% | 17.2% | 4.6% | 18.6% | (4.3%) |
| Net Margin | 8.1% | 9.7% | (1.9%) | (28.5%) | (1.8%) |
| ROE | 2.4% | 0.6% | (0.2%) | (2.3%) | (0.2%) |
| Quick ratio | 0.92 | 1.50 | 0.54 | 0.77 | 0.76 |
| Current ratio | 1.30 | 1.77 | 0.63 | 0.95 | 0.92 |
Figure 3: ANJT’s margins (Source: Thomson Eikon)
Two family owned private companies hold 80% of ANJT’s equity and thus ANJT’s share price and demand are inelastic to the firm’s decreasing earnings margins. ANJT’s shares did not decrease in value as its corresponding revenue declined. Instead, its shares increased with the hiring of a new president. As a result, ANJT’s forward price to earnings ratio of 75x trends higher than the industry average at 20x and direct peers at 26x. This suggests, as shown in Figure 4 below, that ANJT may be overvalued given that its share price has not declined in line with the firm’s poor financial performance.
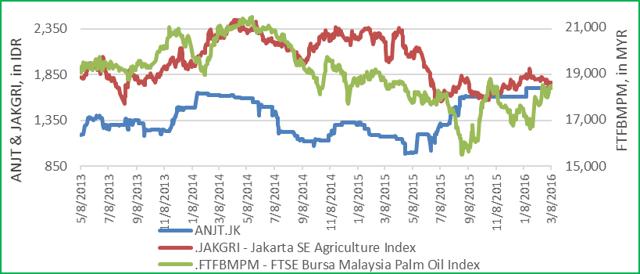
Figure 4: ANJT’s ‘share price vs. relevant indices
ANJT Monte Carlo Simulation
Apart from the historical scenario of ANJT losing key buyers, there also exists additional 5% probability that the company realizes further revenue losses of more than 135 billion Indonesian Rupiah (IDR), or 35% of its expected quarterly revenue. The reason is that half of ANJT’s revenue is from only 3 or 4 buyers, increasing its risk of losing a major revenue source. Figure 5 below shows ANJT’s Monte Carlo simulation revenue distribution illustrating the probability and impact of ANJT falling below its IDR 380 billion quarterly revenue threshold. The graph presents a summary of a 1,000 iterations, ranging from worst case to best case. The analysis shows that ANJT has a 5% probability of ending up with quarterly revenue result at or below IDR 245 billion.
The frequency distribution table (histogram) shows how many of the 1,000 simulated revenue iterations fall within a certain revenue range, i.e. if an outcome occurs with frequency of 50%, this is far more likely an outcome than such occurring with a frequency of 10%. This histogram is used for all three companies’ Monte Carlo simulations.
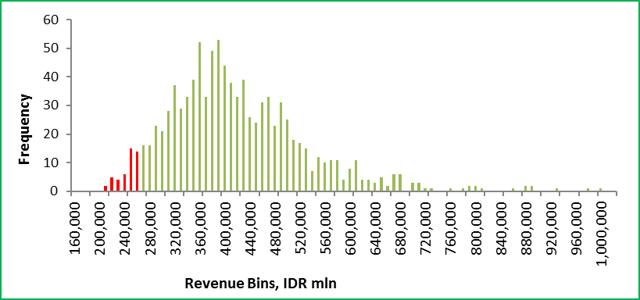
Figure 5: ANJT’s Monte Carlo simulation revenue distribution
ANJT’s potential loss distribution and the respective probability of incurring such a revenue loss are presented in Figure 6 below, in the worst 5% of modelled cases, this is a loss of more than IDR 135 billion. From 2014 to 2015, ANJT’s quarterly variable costs were 50% of their revenue, while their fixed costs were IDR 150 billion, setting a minimum threshold of needed revenue. With Q1 2016 revenue at IDR 294 billion, further buyer loss could result in ANJT no longer being cash flow positive. In summary, ANJT has 35% revenue at risk at a 5% probability for their 2016 forecasted revenue. It has no capacity to incur further revenue loss without causing negative cash flows.
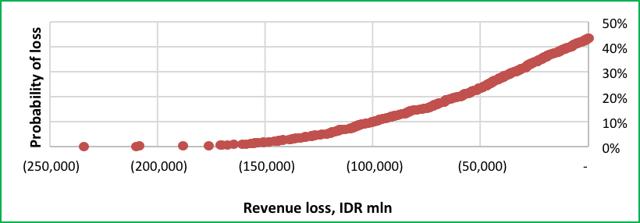
Figure 6: ANJT’s Monte Carlo simulation revenue loss distribution
Sawit Sumbermas Sarana 2015 and 2016 quarterly revenue at risk
– Q4 2015: SSMS lost <5% revenue due to not achieving buyers’ NDPE policies
– 2016: Monte Carlo model results in 42% quarterly revenue at risk at a 5% probability if SSMS does not diversify its buyer base and meet buyers’ NDPE policies
SSMS is a palm oil grower, focused on production and processing. In the second half of 2015, SSMS lost three major buyers as it did not comply with their NDPE policies. In Q3 2015, SSMS had to find substitute buyers when Wilmar and Apical suspended SSMS for non-compliance. Wilmar and Apical respectively represented 16% and 12% of SSMS’ revenue. Sales to PT Sinar Mas Agro Resources and Technology Tbk (SMART), generating 30% of SSMS’ revenue, also decreased to 3%. As shown in Figure 7 below, it took SSMS one quarter to secure Royal Industries Indonesia and Wings Group as replacement buyers, SSMS sourcing 28% of its revenue from them respectively.
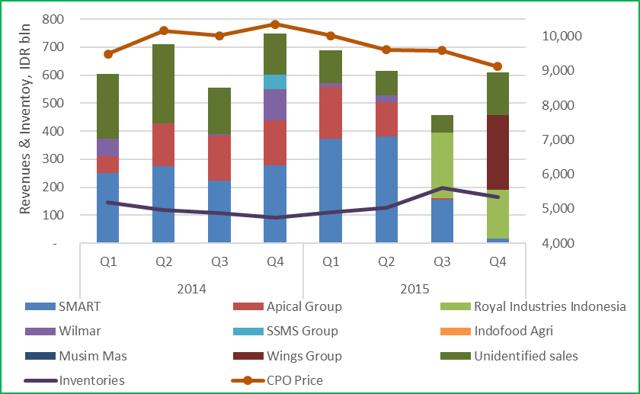
Figure 7: SSMS’ revenue, main buyers, and CPO price
SSMS, as a result had lower earnings in Q3 and Q4 2015, compared to the same quarters in 2014. In both quarters, its revenue decreased 18% year over year with between 0% and 5% of lost revenue traceable to the loss of buyers. In Figure 8 below, research shows that using average reported CPO prices, 13% of the year over year decline in Q4 2015 was likely due to declining CPO prices, with the remaining 5% decline attributable to loss of buyers. Lower sales, increasing inventories and respective storage costs also pushed down net income and margins.
| Metric | Change YoY | % Change YoY | Change
Q4 ’15 / Q4 ’14 |
% Change
Q4 ’15 / Q4 ’14 |
| Revenue IDR million | (244.487) | -9% | (136,958) | -18% |
| CPO selling price IDR/kg | (1,062) | -13% | (1,050) to (1,743) | -13% to -21% |
Figure 8: SSMS’ revenue
In Q3 2015, SSMS revenue and profitability margins decreased significantly with net margin dropping to 4.9%, return on equity falling below 1%, and its cash cycle increasing to 165.7 days. As shown in Figure 9 below, SSMS has reported improved margins in subsequent quarters. As in Q4 2015, the company’s cash liquidity represented by the quick and current ratio was also impacted negatively falling below the company’s historical average. Nonetheless, SSMS revenue at risk remains high while its buyer base remains undiversified.
| Metric | Industry Median | SSMS’ Average | Q2 2015 | Q3 2015 | Q4 2015 | Q1 2016 |
| Operating Margin | 10.9% | 36% | 37.7% | 21.1% | 40.0% | 46.8% |
| Net Margin | 8.1% | 24% | 12.7% | 4.9% | 34.9% | 30.1% |
| ROE | 2.4% | 5% | 2.6% | 0.8% | 7.8% | 4.7% |
| Quick ratio | 0.92 | 3.30 | 2.69 | 6.41 | 1.20 | 1.8 |
| Current ratio | 1.30 | 3.56 | 2.86 | 7.07 | 1.33 | 2.01 |
| Cash Cycle (Days) | 48.1 | 131.47 | 99.5 | 153.4 | 165.7 | – |
Figure 9: SSMS’ margins (Source: Thomson Eikon).
As shown in Figure 10, when SSMS’ revenue fell so did its share price. Despite its Q4 2015 revenue 18% below Q4 2014, SSMS share price recovered during the same period, possibly due to the acquisition of an oilseed processing facility. Research shows that SSMS’ loss of revenue and market share was influenced by the company’s failure to comply with buyers’ NDPE policies. Several of SSMS’s key buyers suspended purchasing due to SSMS’ subsidiary PT Kalimantan Sawit Abadi (PT KSA) continued clearing of peat forests, and subsidiary PT Sawit Mandiri Lestari (PT SML) failure to apply “free prior and informed consent” or conduct a High Carbon Stock assessment. In Q4 2015, SSMS sold PT SML, its NDPE non-compliant asset. Afterwards its share price increased.
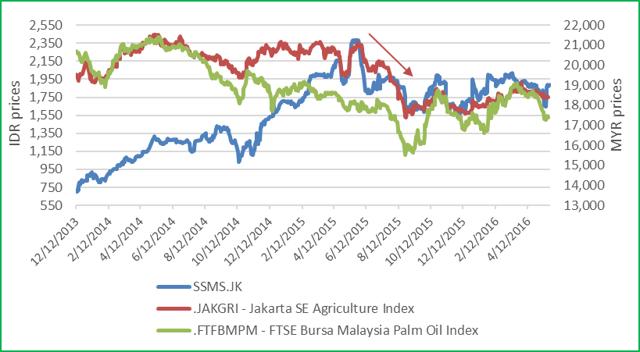
Figure 10: SSMS share price fell concurrently with declining revenue
SSMS Monte Carlo Simulation
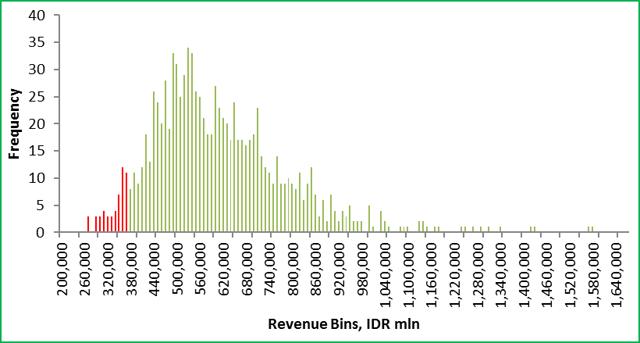
Figure 11: SSMS’ Monte Carlo simulation revenue distribution – 40% revenue at risk
Beyond the loss of these buyers, shown in Figure 11 above, there exists an additional 5% probability that SSMS may realize further revenue losses of more than IDR 230 billion, or 42% of its expected quarterly revenue. The Monte Carlo simulation’s revenue distribution shows that the probability of SSMS falling short of its expected quarterly revenue threshold of IDR 546 billion is material. The chance of SSMS managing to secure only IDR 325 billion of sales is 5%.
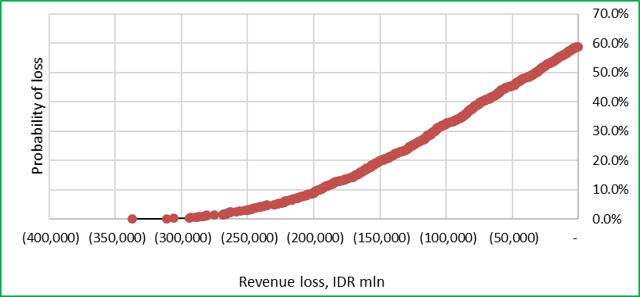
Figure 12: SSMS’ Monte Carlo simulation revenue loss distribution – 5% chance of losing 42% of its revenue
The simulation’s potential revenue loss distribution, as well as probabilities of the loss, is presented in Figure 12 below. There is a 30% chance that SSMS loses IDR 100 billion of quarterly sales, 5% chance of losing IDR 230 billion. As compared to ANJT however, SSMS has a better chance to manage its revenue risk. SSMS’ level of variable costs is lower, averaging 45%, while its fixed and financial costs are c. IDR 105 billion per quarter. However, in Q3 2015, SSMS’ fixed and financing costs were close to IDR 200 billion, i.e. SSMS’ projected revenue level to cover such fixed and variable costs is about IDR 400 billion. Alternatively, SSMS’ realized revenue should not drop more than 35% from a business-as-usual scenario, or the company could incur negative earnings.
Provident Agro 2015 and 2016 quarterly revenue at risk Q4
– 2015: PALM lost 15% revenue due to not achieving buyers’ NDPE policies
– 2016: Monte Carlo model forecasts 37% quarterly revenue at risk at a 5% probability if PALM does not diversify its buyer base and meet buyers’ NDPE policies
PALM is a palm oil producer and processor in Indonesia. In 2015, the company lost one major buyer due to its failure to comply with the buyer’s NDPE policy.
In 2014, shown in Figure 13, PALM generated 23% of its revenue from sales to Golden Agri-Resources. In 2015, Golden Agri-Resources suspended purchases from PALM because PALM’s subsidiary PT Langgam Inti Hibrindo (PT LIH) was accused of land burning in breach of Golden Agri-Resources’s NDPE policy. It took PALM one quarter to secure Sinar Jaya as a replacement buyer. Likewise, as other smaller buyers also suspended purchases from PALM, PALM’s Q4 2015 revenue decreased quarter-over-quarter.
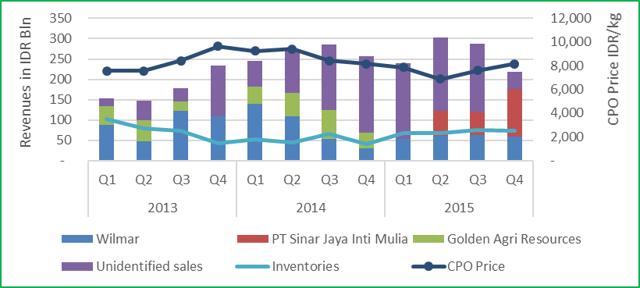
Figure 13: PALM’s revenue, main buyers, and stock price
Shown in Figure 14 below, comparing Q4 2015 with the same quarter year over year, PALM’s revenue decreased 15%, driven by its undiversified buyer base. On annual basis, PALM revenue was flat.
| Metric | Change YoY | % Change YoY | Change
Q4 ’15/Q4 ’14 |
% Change
Q4 ’15/Q4 ’14 |
| Revenue IDR millions | (11,040) | -1% | (38,993) | -15% |
| CPO Price IDR/kg | (1,192) | -13% | (67) | 0.1% |
Figure 14: PALM’s revenue
Despite losing a major buyer, PALM’s operating margins stayed positive, above industry median but below the company’s historical average. At the same time, its net margin and return on equity were negative.
| Metric | Industry Median | PALM’s Average | Q2 2015 | Q3 2015 | Q4 2015 | Q1 2016 |
| Operating Margin | 10.9% | 15.1% | 20.3% | 32.4% | 13.3% | 12.4% |
| Net Margin | 8.1% | (11.6%) | 5.4% | (4.5%) | 2.8% | (10.8%) |
| ROE | 2.4% | (3.3%) | 1.1% | (1.0%) | 0.3% | (1.2%) |
| Quick ratio | 0.92 | 0.48 | 0.51 | 0.40 | 0.14 | 0.11 |
| Current ratio | 1.30 | 0.59 | 0.59 | 0.51 | 0.23 | 0.18 |
| Cash Cycle (Days) | 48.1 | 42.22 | 32.3 | 40.4 | 46.2 | 16.4 |
Figure 15: PALM’s margins (Source: Thomson Eikon).
Shown in Figure 15 above, from Q3 2015 to Q1 2016, PALM’s liquidity declined below its historical average. The company’s quick and current ratios fell below the industry median, and below 1. This implies that PALM may have had difficulties servicing its payables and liabilities, with constrained liquid short-term investments. As shown in Figure 16 below, PALM’s share price also declined in sync with revenue reduction.
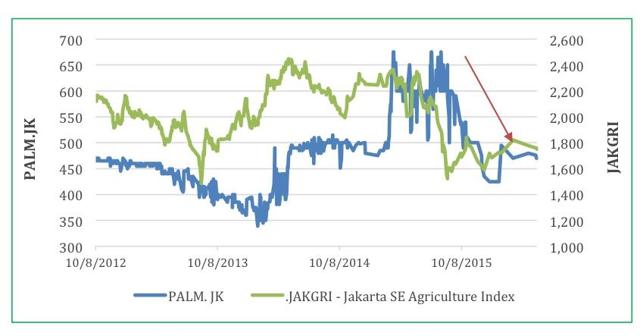
Figure 16: PALM’s revenue, main buyers, and stock price
PALM Monte Carlo Simulation
Beyond the revenue reduction attributable to loss of a major buyer, there exists an additional 5% probability that Provident Agro will experience further revenue losses of more than IDR 88 billion or 37% of its expected quarterly revenue. This is mainly driven by PALM’s undiversified buyer base. Figure 17 below shows the revenue distribution generated with a Monte Carlo simulation, indicating varied possibilities for the company’s revenue behaviour. The probability of the palm grower achieving revenue well below the expected IDR 230 billion is material, the probability of only securing revenue of IDR 140 billion is 5%.
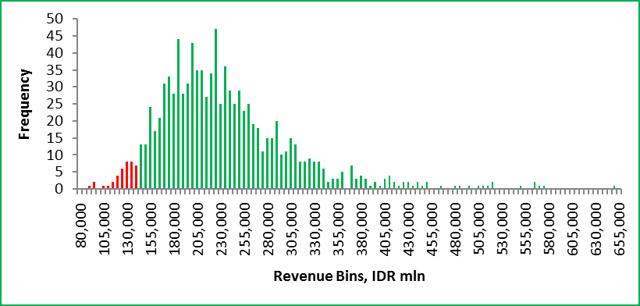
Figure 17: PALM’ Monte Carlo simulation revenue distribution
Figure 18 below presents PALM’s Monte Carlo Simulation’s potential revenue loss distribution. PALM’s variable costs are 73% of its revenue, with fixed costs averaging IDR 75 billion, or 27%. Therefore, PALM needs to achieve quarterly earnings IDR 280 billion to cover its costs. If PALM is to be cash flow positive, the company may need to exceed this revenue threshold.
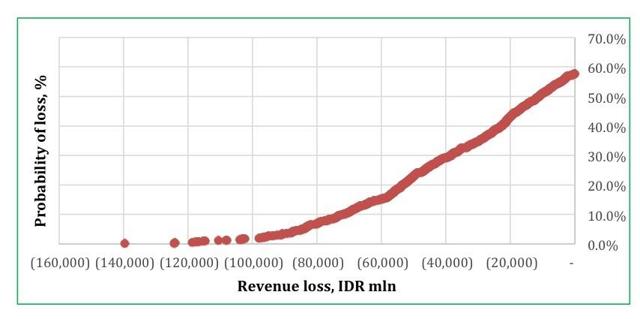
Figure 18: PALM’s Monte Carlo simulation revenue loss distribution
Appendix I: Monte Carlo Simulation Methodology
A Monte Carlo simulation is a common forecasting technique that allows professionals to model risk, given a set of assumptions. The process provides the decision-maker with the frequency of a range of possible outcomes and the probabilities that they will occur, for any choice of action. It shows extreme possibilities demonstrating risks that may not be obvious at a casual glance – at a 5% or less probability – on both sides of a distribution.
Monte Carlo builds models of possible results by substituting a range of values – using a lognormal probability distribution – for any factor that has inherent uncertainty. The main factors for the modelled Monte Carlos simulations in this paper are:
- The purchases of each individual corporate buyer,
- Their respective growth rates,
- Unidentified corporate purchases, and
- Their growth rates.
The employed Monte Carlo simulation calculates results for 1,000 iterations, each time using a different set of random values drawn from the lognormal probability distribution, thus generating lognormally distributed and likely outcomes for the companies’ quarterly revenue. Depending upon the number of uncertainties and the ranges specified for them, a Monte Carlo simulation could involve 1,000 or more iterations – or recalculations – before it is complete. In this manner, Monte Carlo simulation can be used to forecast revenue at risk given these companies inability to meet their buyers’ NDPE policies. Thus, Monte Carlo simulations provide iterations that not only demonstrate what could happen, but also the probability of each outcome.
These modelled simulations estimate the quarterly revenue each firm can achieve, with a corresponding specific probability. The outcomes discussed above showcase revenue estimates at 5% probability.