Progress achieved by many palm oil refiners and some FMCG companies may be weakened by changes in the landscape of the FMCG/downstream industry.
Download PDF here: Consolidation Report Final July 23 2018
In 2017, Chain Reaction Research (CRR) calculated that 74 percent of palm oil refinery capacity in SE Asia applied No Deforestation, No Peat, No Exploitation (NDPE) sourcing policies. In 2010, zero percent of SE Asian refiners had an NDPE policy. Larger refineries have led this change, in part due to engagement from concerned financiers. This development sets CRR’s sights further downstream to the fast-moving consumer goods (FMCG) industry, which purchases 90 percent of global palm oil and palm oil derivatives production. In the last 20 years, the consolidation in the FMCG industry through mergers and acquisitions (M&A) has gone hand-in-hand with better ESG and NDPE policies. It should be noted that in the last five years, however, new participants such as private equity have emerged in the FMCG ownership structures. In early 2017, the unsuccessful bid by Kraft Heinz on Unilever (seen as an FMCG leader in sustainability) was a wake-up call. Progress achieved by many palm oil refiners and some FMCG companies may be weakened by changes in the landscape of the FMCG/downstream industry. This report investigates the impact of these global M&A/divestment trends on deforestation risks and NDPE policies.
- FMCG consolidation in the ‘pre-private equity era’ went hand-in-hand with improving palm oil policies. In general, larger FMCG companies have stronger forest and palm oil policies than smaller entities. Specifically, Unilever had a leadership position in the development of the Roundtable on Sustainable Palm Oil (RSPO) and NDPE policies. In 2018, several large FMCGs encouraged full supply chain transparency by publishing supplier lists.
- Acquisitions by private equity could fragment the FMCG’s palm oil policies. Activist shareholders’ pressure has forced larger publicly-listed companies to focus on short-term strategies like divestment of under-performing assets and increasing dividends. As a result, palm oil-using industries might become controlled by private equity or other firms.
- Private equity industry’s ESG, forest and NDPE policies are lagging. Compared to large FMCG entities, private equity seems to score low on ESG policies while NDPE policies are often absent.
- Private equity investments might continue to gain share. By 2020, forecasts indicate that private equity and hedge funds may control 4.5 percent of total global wealth with further growth to 2030. The search by investors for higher returns will probably lead to further growth of assets managed by private equity.
- Deforestation risk and investment risk might increase substantially in this paradigm of alternative investments, unless investors take heed. Financiers are operating in an environment of growing alternative investments (private equity, hedge funds) which have less ESG transparency. Consequently, investors might face higher deforestation risk than anticipated. This could be solved by adding NDPE as a central theme in both their mandates and loans to private equity. As an example, HSBC and Bank of America may be impacted by how KKR will operate regarding palm oil policies in Unilever’s former Spreads business.
The Consolidation Era: Private Equity’s Increased Role
Through mergers and acquisitions, many business sectors have moved from a fragmented to a consolidated market. Consolidation has been relatively strong in sectors with a high level of capital and/or marketing intensity, producing homogeneous products for mass markets without a strong connection to specific locations. The FMCG industry is an example of this market consolidation.
Large (publicly-listed) FMCG companies buying smaller private companies mainly initiated downstream consolidation. However, in the last 10 years, an increasing importance of private equity-financed deals can be observed. An important research theme in this report is how the different trends in consolidation in the downstream sector have affected NDPE policies and how the new consolidation trends might affect NDPE policies in the future. This question can be broken down into three sub-questions:
- Do large FMCG companies show improving NDPE or forest policies and does consolidation lead to a reduction of deforestation?
- Is consolidation still a trend or is there increasing fragmentation? What are the driving factors? In this context, how does the increasing importance of private equity impact this trend?
- And how do the changes in financing structures, including private equity, affect deforestation policies? Do private equity investors have a different level of deforestation policies than listed companies?
Unilever: Leader, M&A Target, and Leakage Market Participant
Global consumption of all vegetable oils (soy and palm oil) comes from 80 percent in food ingredients, 13 percent in biofuels, and the remaining seven percent in home and personal care (detergents and shampoos) and in industrial and other uses (Byerlee, Falcon, Naylor, The Tropical Oil Crop Revolution 9-10). For palm oil and palm kernel oil, as shown in Figure 1 (below), Palm Oil Investigations estimates that 72 percent is used in food products, 18 percent in home/personal care, and 10 percent in biofuels and feedstock. This means that 90 percent of palm oil is used in the FMCG industry.
Figure 1: Palm oil and palm kernel oil used by the FMCG industry
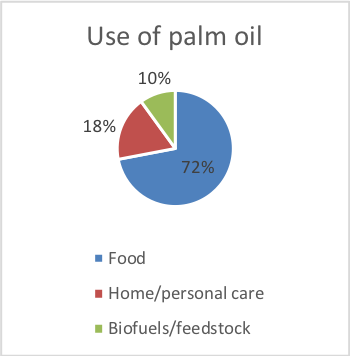
Source: Palm Oil Investigations.
These FMCG palm oil purchasing companies are located in India, China, and Pakistan and in the European Union, and to a lesser extent in the Americas and Africa. In the Americas, soy oil is the dominant edible oil.
Within this context, Unilever, who is the largest customer in the palm oil refinery sector and a founding member of the Roundtable on Sustainable Palm Oil (RSPO), has led the FCMG sector’s development of NDPE guidelines.
A first observation is that Unilever’s leadership in the palm oil market as the largest customer (impacting eight percent of the total global production) has been crucial in developing RSPO and NDPE. In a fragmented market in which the largest purchaser would have been responsible for less than one percent of the volume, the chances for effective campaigning by NGOs would have been lower.
A second observation is the failed bid by Kraft Heinz for Unilever in 2017. If the bid was successful, Unilever’s NDPE policies and transparency could have been diluted to Kraft Heinz’ lower level. However, on March 21, 2017, Kraft Heinz stated:
The Company’s new policy states it will procure palm oil products in an ethical, transparent and sustainable manner, and will only purchase palm oil and derivatives 100 percent certified by the Roundtable on Sustainable Palm Oil.
A third observation is that as a reaction to the failed bid, Unilever announced accelerated cost savings, higher dividends, and the divestment of its Spreads business, which is one of its largest divisions that purchases palm oil. This observation includes the divestment of its Spreads business to the private equity firm KKR, which has no NDPE policies and no supply chain transparency. However, KKR stated December 15, 2017 that it would be:
…continuing to follow Unilever’s responsible sourcing policies, including working towards the goal of sourcing 100 per cent sustainable palm oil by 2019.
The Unilever example highlights the current trends in the FMCG industry:
- The pressure from financial markets to increase shareholder value leads to divestment of underperforming assets and/or further cost control.
- These processes could be further fueled by the low interest rate environment. The wealthy part of the global population, asset managers and pension funds want to diversify financial assets into higher-leveraged and higher-yielding private equity instruments. Consequently, private equity and other alternative investment vehicles might get increasingly involved in the FMCG industry.
Do the trends in the structure and financing related to consolidation in the FMCG sector have an impact on NDPE or deforestation policies? The following questions need to be answered:
- Do larger FMCG companies have better NDPE policies than small companies?
- Have the changes in ownership “from public to private” had an impact on NDPE or forest policies?
Consolidation in FMCG: More Transparency, Better NDPE Policies
Outside the key Asian consuming markets of India, China, and Pakistan, companies active in the FMCG industry are crucial buyers in the palm oil market. For example, Unilever’s purchasing activity already impacts eight percent of the global palm oil production.
Large FMCG Companies are More Transparent on CSPO Purchases
The 2016 WWF report ‘Palm Oil Buyers Scorecard’ seems to suggest that size does not matter “when it comes to which companies are sourcing CSPO”. Figure 2 (below) shows that 61 percent of the researched companies that use palm oil are purchasing 99 to 100 percent CSPO (Certified Sustainable Palm Oil). Because of the low number of companies assessed, the outcomes for these ranges are not statistically relevant.
Figure 2: Scorecard of 99 retailers, food companies and food-service companies.
| Size (palm oil volume used in tons) | Number of companies | Of which are 99-100% CSPO buyers | % |
| <1,000 | 6 | 3 | 50% |
| 1,000-10,000 | 36 | 22 | 61% |
| 10,000-50,000 | 31 | 21 | 68% |
| 50,000-100,000 | 12 | 7 | 58% |
| 100,000-1,000,000 | 13 | 6 | 46% |
| >1,000,000 | 1 | 1 | 100% |
| Total | 99 | 60 | 61% |
| Source: WWF 2016. |
The observation that large companies do not have a more sustainable purchasing policy for palm oil seems illogical. Larger companies should be more sensitive to reputation risks. As such, campaigners should be more focused on these companies to change their policies, as they are the leaders in the FCMG sector.
It is important to note that the WWF study has its limitations. The 99 companies that responded purchase six million tons of CPO annually, which is 10 percent of the global production. Thus, 90 percent of the CPO is bought by companies that are not transparent and/or were not approached. These are mainly smaller companies in India, China, India, Pakistan, Indonesia, and also in Europe and the Americas.
In February 2018, two large corporations – Unilever and Nestlé – made an important step in improving their transparency in the palm oil supply chain by publicly disclosing their lists of suppliers and palm oil mills they are connected to. This showed their leadership on ESG issues in the FMCG industry. After these announcements, more companies in the FMCG sector have followed suit.
In 2017, Tamimi and Sebastianelli’s Transparency among S&P 500 companies: an analysis of ESG disclosure scores concluded that the disclosure on ESG factors is much better for large companies:
The results also reveal that large-cap companies have significantly higher ESG disclosure scores than mid-cap companies and that governance factors impact ESG disclosure. Significantly higher ESG disclosure scores are observed for S&P 500 firms with boards of directors that: are larger, more gender diverse, allow CEO duality, and link executive compensation to ESG scores.
In Greenpeace’s March 2018 report Moment of Truth, 16 large members of the Consumer Good Forum were questioned about their transparency in the palm oil supply chain. Only eight of them showed high transparency, while eight others did not. Figure 3 (below) shows that companies which are transparent in their palm oil supply chain have, on average, much higher 2017 revenue (USD 40.3 billion) versus the companies which, according to Greenpeace, “refused to reveal who produced their palm oil, thereby concealing the extent of their complicity in rainforest destruction.” They have, on average, USD 25.6 billion sales (2017).
Figure 3: 16 leading members of Consumer Goods Forum
| Company:
Transparent |
Revenue
USD bn |
Ownership | Company:
Not transparent |
Revenue USD bn | Ownership | |
| Colgate | 15.5 | Listed | Ferrero | 10.3 | Private | |
| General Mills | 15.6 | Listed | Hershey | 7.5 | Listed | |
| Mars | 33.0 | Private | Johnson & Johnson | 76.5 | Listed | |
| Mondelez Int | 25.9 | Listed | Kellogg’s | 12.7 | Listed | |
| Nestlé | 91.6 | Listed | Kraft Heinz | 26.2 | Listed | |
| P&G | 65.7 | Listed | PepsiCo | 63.5 | Listed | |
| Reckitt Benckiser | 14.8 | Listed | PZ Cussons | 1.0 | Listed | |
| Unilever | 60.7 | Listed | JM Smucker | 7.4 | Listed | |
| Average | 40.3 | 25.6 | ||||
| Growth 2010-17 | -7% | +12% |
Left – transparent companies in palm oil supply chain. Right – non-transparent companies in palm oil supply chain. Sources: Greenpeace, Chain Reaction Research.
The differences in ownership (publicly listed versus private) do not have a big impact on the outcomes. In each group, there is one privately-held company – Mars and Ferrero.
Larger FMCG Companies Have Better Forest and Palm Oil Policies
Figure 4 (below) sorts FMCG companies by revenue and Forest 500 policy improvements. This research and the outcomes below by Chain Reaction Research is based on the Forest 500 (Global Canopy) scores on Forest Policies and Palm Oil Policies for 58 FMCG companies in 2017. These FMCG entities are categorized by revenue level. The main conclusions surrounding the size of companies are as follows:
- In 2017, larger FMCG companies had, on average, better policies than smaller companies.
- FMCG companies with revenue above USD 50 billion reached an average score of 3.7 in forest policies. In palm oil policies, they achieved the maximum score of 5.0.
In 2017, all groups of companies, categorized on descending size of annual revenue, have a descending average score on both forest (column 1 and 2) and palm oil policies (column 4) in the Forest 500.
Figure 4: Scorecard of 58 FMCG companies in Forest 500 (score 0 to 5). Averages per category.
| Size (USD billion sales) | Forest 500 Forest Policy 2014 | Forest 500 Forest Policy 2017 | Change 2014-2017 Forest 500 Forest Policy | Forest 500 Palm Oil policy 2017 |
| Largest (>USD 50 billion) | 3.5 | 3.7 | +0.2 | 5.0 |
| Large (10 – 50) | 2.0 | 3.0 | +0.9 | 3.8 |
| Mid (5 – 10) | 1.8 | 2.0 | +0.2 | 3.2 |
| Small (0 – 5) | 1.2 | 1.9 | +0.7 | 2.7 |
Sources: Chain Reaction Research, Global Canopy Programme.
Time has been an important factor for forest policy improvement. As noted in Figure 4 above, a widespread improvement in sustainability and forest policies in the downstream companies occurred from 2014 to 2017. Companies in all groups categorized on size have improved the average total scores (including palm, soy, cattle and timber; for 2014 there were no separate palm scores), visible in the italic (third) column. The companies with revenue above USD 50 billion continued to improve from a high level and smaller companies are catching up.
However, in 2017, the average scores of the smaller companies continued to lag the scores of the larger companies. The last column shows the score specifically on palm oil policies. There are only comprehensive palm oil data for 2017 (not for 2014). The larger the company, on average, the higher the score on palm oil policies.
Conclusions on relationship size of FMCG actor and NDPE/forest policies
- Compared to smaller companies, the larger companies perform better on ESG/palm oil transparency as well as forest/palm oil/NDPE policies.
- Within the context of the top 10 percent in a market, the size of a FMCG company does not have a large impact on certified sustainable palm oil purchasing.
- As the larger companies have more resources to track risks, they are more aware and better able to prepare to implement more transparency on supply chains (Unilever, Nestlé).
Impact of M&A and Divestment on Deforestation: 3 Dimensions
Larger FMCG companies have better ESG/forest/palm oil/NDPE policies than smaller companies. The next step is to analyze the impact of M&A and of divestments on these policies. There are three sub-questions to explore:
- What happens with forest policies if target and acquirer merge?
- Does the pressure from financial markets lead to less sustainable actions by the target which is forced to divest activities?
- If new financiers like private equity get increasingly involved, does this reduce transparency and sustainability.
1. Target and Acquirer’s Forest Policies: Risks and Opportunities
As a consolidator in recent years in both personal care products and in spreads, Unilever has had strong opportunities to improve forest and NDPE policies of the targets it acquired.
On February 17, 2017, Kraft Heinz made a USD 143 billion bid for Unilever. Kraft Heinz is 51 percent controlled by the Brazilian private equity firm 3G Capital and Warren Buffett. If Kraft Heinz had succeeded in this bid, a large publicly listed company with strong sustainability policies would be controlled by a private equity-controlled entity with less strong policies. This case study is a good example how a merger might affect the forest policies in a new entity. Figure 5 (below) shows how Unilever’s forest policy in 2017 showed the largest head start in soy and pulp & paper and not in palm oil, according to Global Canopy’s Forest 500. The catch-up in palm oil policy by Kraft Heinz was probably due to its more stringent policies in 2017 (see below).
Figure 5: Forest policies for Kraft Heinz and Unilever.
| Kraft Heinz | Unilever | |
| Forest 500 forest policy 2014 | **** | |
| Forest 500 forest policy 2017 | ** | **** |
| Palm oil | ***** | ***** |
| Soy | *** | |
| Pulp & Paper | ***** | |
| Total sales (USD millions) | 26,490 | 54,899 |
Source: Forest 500.
However, on February 19, 2017, Kraft Heinz pulled its bid for various reasons including Buffett’s longtime aversion to hostile bids. While he supported the “friendly” takeover of H.J. Heinz in 2013 and later combining it with Kraft Foods Group Inc. in 2015 to create Kraft Heinz, he is not in favor of unfriendly bids.
It is interesting to note that during the short time period of the bid on Unilever, Kraft Heinz has been criticized on its sustainability intentions. Later, on March 21, 2017, Kraft Heinz announced it was investing USD 200 million to expand its CSR commitment in order to reduce malnutrition and to decrease its environmental footprint. Under its new policy, Kraft Heinz would only purchase palm oil products 100 percent certified by the RSPO. Kraft Heinz also said it would start pushing its global suppliers to achieve palm oil traceability, prohibit the use of child and forced labor, and conserve forests and habitats. Their new policy also includes humane poultry and beef sourcing commitments. This strengthening of its policies was a consequence of a learning process and allowed Kraft Heinz to be ready for future bids.
This example shows that although a merger might have led to dilution in ESG and forest policies of the sustainability leader for the combined company, it can also lead to ESG improvements for the acquirer. A critical approach of financial markets about weak ESG and forest policies of the acquirer can be very helpful.
2. The Risk of a Non-Sustainable Reaction by the Target: Divestment of a Sustainable Asset to a Non-Sustainable New Owner
Pressure from financial markets and the dominance of shareholders’ value creation in the multi-stakeholder environment can lead to a negative impact on forest/NDPE policies. For instance, the Kraft Heinz bid has had its impact on Unilever’s strategy. Unilever has subsequently announced:
- An acceleration of cost savings.
- The divestment of its Spreads business.
- The return of more capital to shareholders.
Unilever’s strategic actions seem to be announced in order to make future bids more expensive and thus more difficult. Unilever seems to have adapted its strategy to the current socio-economic and global financial narratives.
Unilever’s announcement on April 6, 2017 that it will sell its Spreads business may have been a reaction on demands by the mainstream investors to reduce Unilever’s exposure to activities that decrease top-line growth. Its Spreads business was relatively important to Unilever’s sustainability profile. Unilever’s sale of its Spreads business will deteriorate Unilever’s sustainable agricultural sourcing percentage, and there remains the risk that KKR, the new owner of the Spreads division, could be less stringent on NDPE policies. This is despite KKR’s claim that it is “continuing to follow Unilever’s responsible sourcing policies, including working towards the goal of sourcing 100 per cent sustainable palm oil by 2019.”
Another example is Reckitt Benckiser’s (RB) July 2017 sale of its French’s mustard and Frank’s RedHot sauce food business to McCormick, the US-based spices company, for USD 4.2 billion. RB sold non-core activities in order to reduce its USD 18 billion debt burden. RB’s forest policies (Forest 500 score of 4) are much better developed than those of McCormick. RB focuses on achieving NDPE in its supply chain and has published its list of suppliers, while McCormick lacks forest policies. McCormick focuses on 100 percent sustainable sourcing in only five of its key spices.
Another example (from outside the food industry) of a non-sustainable reaction by a sustainability leader, is from AkzoNobel. Its reaction on pressure from activist shareholders mirrored the reaction by Unilever. The announced divestment by AkzoNobel of its Specialty Chemical division to the private equity groups Carlyle Group and GIC was a reaction on an aggressive bid process by competing private equity firm PPG on AkzoNobel. The divestment of 45 percent of EBITDA to the much less sustainable Carlyle Group and GIC means a dilution in the impact of AkzoNobel as a sustainability leader in the chemical sector.
Besides Unilever’s sale of the Spreads business, there is not yet another example of a large FMCG company that needs to sacrifice a major part of its sustainability/deforestation approach.
Conclusion: The three examples above show that large, publicly-listed FMCG companies need to do a balancing act between their own values that sometimes contain sustainable elements in sourcing, labor and balance sheet ratios, versus demands from traditional shareholders with a focus on financial accretion.
3. The Leakage Risks of New Ownership Structures: Private Equity
In the last two decades, there have been changes in the ownership of FMCG companies. There has been an increase of private equity financing as well as companies/families from developing markets that have increased M&A activity.
For instance, the beer sector has been shaken up by a two-decades consolidation process through Brazilian financiers which have combined large breweries like AmBev, Interbrew, Anheuser-Busch, Modelo and SABMiller. This has created the largest brewer in the world (AB InBev) with one quarter of the global beer volume and a much higher percentage of the global profit pool. In the meat sector, the Brazilian company JBS has bought US market leadership positions by acquiring Pilgrim’s Pride (2009). The large palm oil-consuming FMCG companies in food, personal care and home care (Unilever, P&G, etc.) are still publicly listed companies, although the bid by Kraft Heinz on Unilever would have changed this.
The fact that private equity and billionaires are buying out publicly listed companies leads to new challenges for traditional investors such pension funds. On the one side, it is positive that the investors (like many pension funds) are in a process of raising the sustainability of their investment portfolios through engagement, selection and exclusion policies. However, on the other side, the continuing globalization of capital markets, the increasing wealth of multi-millionaires/billionaires, and low interest rates have fueled the process of de-listing of publicly-listed companies. The consequences of becoming private are that these companies could lead to a lower level of transparency in financial and overall ESG reporting, and that the opportunity to engage as a shareholder has been lost.
Key questions are:
- What is the size of this new category of financial investors/owners?
- How is its performance in ESG and palm oil policies?
Private equity is still dwarfed by publicly listed entities. Figure 6 below indicates that the size of alternative investments (private equity, hedge funds, activist shareholders) is now between 3.3 to 4.5 percent of all global wealth. These alternative investments represent 47 percent (in 2020) of private equity. It is worthwhile to note that HNWI’s (High Net Worth Individuals: net assets per head greater than USD 1 million) invest 10-15 percent of their portfolio into alternative investments (source: Cap Gemini World Wealth Report 2017). OECD’s 2013 report indicated 4 percent of total global capital markets were invested in private equity.
Figure 6: Rising share of private equity investments.
| USD trillion | 2004 | 2007 | 2013 | 2020F | CAGR |
| Private equity | 1.0 | 2.5 | 3.6 | 7.0 | 12.9% |
| Real estate | 0.5 | 0.8 | 1.4 | 2.7 | 11.1% |
| Hedge Funds & Other special funds | 1.0 | 2.0 | 2.9 | 4.8 | 10.3% |
| Total | 2.5 | 5.3 | 7.9 | 14.5 | 11.6% |
| Total wealth (based on Credit Suisse) | 161.0 | 200.0 | 240.0 | 324.0 | 4.5% |
| HNWI (>USD 1 million per head) total assets | 37.9 | 50.1 | 52.4 | 76.9 | 4.5% |
| Private equity as % of total wealth | 0.6% | 1.3% | 1.5% | 2.1% | |
| Alternative investments as % of total wealth | 1.6% | 2.7% | 3.3% | 4.5% | |
| HNWI total assets as % of total wealth | 23.5% | 25.1% | 21.8% | 23.7% |
Sources: Chain Reaction Research, Credit Suisse.
An important and often-used strategy of private equity funds is the leveraged buy-out. This means that they add bank loans and bonds to finance a take-over. While listed companies often limit their borrowing to a net debt/EBITDA ratio of 2-3X, private equity accepts leverage to 5-6X. The above-mentioned 3.3 to 4.5 percent is mainly based on the equity part of private equity, while the multiplier effects of the loans are excluded.
In 2018, the Boston Consulting Group (BCG) stated that the number of US companies controlled by private equity had already surpassed the number of publicly-listed companies by 2007. However, the value of publicly-listed companies still dwarfs the value of private equity held companies by 32X times (USD 27 trillion versus USD 862 billion). BCG points out that the United States is the most developed private equity market, but it estimates that still only 1.6 percent of United States’ GDP is owned by private equity firms. However, in Australia the penetration level is even lower at 1.1 percent, and no other country has more than 0.5 percent.
Traditionally, private equity invested a lot of money in FMCG companies, as they liked the stability of FMCG’s cash flows and the strength of the balance sheets. These two characteristics formed a good basis for a leveraged buy-out, which means that take-overs were financed primarily by debt. Although gradually, private equity is moving to other industries, but FMCG still remains a core area.
Growth drivers of private equity will continue. The growth factors for alternative investments and private equity remain intact as the number of relatively rich individuals will continue to grow along with their total wealth. The Cap Gemini Global Wealth Report 2016 forecasts that HNWIs total wealth will rise to USD 106 trillion in 2025 (a growth of 67 percent versus 2015). HNWI’s wealth has grown from USD 42.7 trillion in 2010 to USD 63.5 trillion in 2015. In these years, ultra-HNWIs (net assets greater USD 30 million) have been the main driver for this. Traditionally the ultra-HNWIs are eager to invest money into private equity, and also directly into companies, as they are able to take more risk than mainstream investors. Because of this momentum, the anticipated 4.5 percent of total global wealth invested in alternative investments might continue to grow.
Private equity is lagging in ESG, forest policies and NDPE policies. Concerning the ESG status of the category of alternative investments, it is worthwhile to take into account the following reports and benchmarking outcomes:
- In the 2018 Chain Reaction Research report ESG Discrepancy Between Soy Growers and Financiers Creates Risk of More Expensive Financing, the policy analysis (page 16 and further) showed that asset managers have low or even no scores on ESG policy. The outcomes were much lower than for the bank sector that was researched.
- In 2013, the VBDO, in association with Deloitte, released a study on ESG reporting in private equity firms. The conclusion was that still a lot of work could be done to improve reporting and execution. The study clearly underlined the lack of transparency on their role and activities related to sustainability.
In 2017, UNPRI launched guidance on the incorporation of ESG rules in private equity funds and mandates. In coordination with UNPRI, the Private Equity Growth Capital Council (PEGCC) developed Guidelines for Responsible Investment focusing on environmental, health, safety, labor, governance and social considerations. These guidelines can be used as the foundation for a private equity ESG framework.
In 2018, private equity has still limited ESG policies. Out of 113 asset managers in the Forest 500, only one private equity group is covered. As shown in Figure 7 (below), the private equity group 3G Capital Partners has a zero score on forest policies and no palm oil policies. BNP Paribas Asset Management is leading the asset managers list with a score of 4, but well-known names as BlackRock, Vanguard, and Dimensional Fund Advisors have low scores.
Figure 7: Assessment of a selection of top asset managers in Forest 500.
| Asset managers | Forest 500 Score | Palm oil policies |
| BNP Paribas AM | 4 | Yes |
| Credit Suisse AM | 4 | Yes |
| Deutsche Bank AM | 4 | Yes |
| HSBC AM | 4 | Yes |
| Blackrock | 1 | No |
| Vanguard | 0 | No |
| Dimensional Fund Advisors | 0 | No |
| 3G Capital Partners | 0 | No |
Sources: Global Canopy Programme, Chain Reaction Research.
The global top-10 (based on 5-year fundraising) private equity groups (as a sub-segment of the asset managers) are not included in the Forest 500 scores. A quick scan of their palm oil-specific policies delivers no ground for optimism. As shown Figure 8 (below), several private equity groups have no ESG page, or only a generic statement without any detailed targets and which only includes ambiguous remarks like “doing good for the earth”. The ESG reports often remain very vague.
Figure 8: Assessment of the top-10 in global private equity.
| Private equity firm | Forest 500 Score (0 to 5) | Palm oil policies | Level of ESG reporting | 5-year fundraising (USD billion) |
| Blackstone | No | No | Generic statement | 58.3 |
| KKR | No | No | ESG report | 41.6 |
| Carlyle Group | No | No | ESG report | 40.7 |
| TPG Capital | No | No | ESG report | 36.1 |
| Warburg Pincus | No | No | Generic statement | 30.8 |
| Advent International Corporation | No | No | No ESG page | 27.0 |
| Apollo Global Management | No | No | No ESG page | 24.0 |
| EnCap Investment | No | No | Generic statement | 21.2 |
| Neuberger Berman Group | No | No | Statements on ESG integration, several memberships | 20.4 |
| CVC Capital Partners | No | No | ESG report | 19.9 |
| Total top-10 | 320.0 |
Sources: Global Canopy Programme, Chain Reaction Research, PEI 300.
KKR is the new owner of Unilever’s Spreads business. Most of KKR’s financers have no palm oil policies. However, the positions of Bank of America and HSBC are interesting. HSBC has adapted NDPE policies for growers, refiners and traders. Bank of America has policies condemning illegal logging and sees RSPO certification as a minimum standard. HSBC and Bank of America may be impacted by how KKR will operate regarding palm oil policies in Unilever’s former Spreads business. Finally, this list of KKR financers is not complete as the separate equity stakes in which KKR has invested have their own list of financers, contributing to a lack of transparency in financial relations.
| May 2018 | % of shares | Value (USD m) | Forest 500
score |
Palm oil policy |
| Top-7 Shareholders | ||||
| Valueact Capital Partners | 10.2% | 1,120 | NA | No |
| FMR | 6.9% | 759 | 0 | No |
| Morgan Stanley | 5.2% | 571 | 3 | No |
| Capital Group | 3.4% | 374 | 0 | No |
| Bank of America | 3.0% | 332 | 3 | Yes |
| Principal Financial Group | 2.9% | 322 | 0 | No |
| Bank of Montreal | 2.3% | 249 | 2 | No |
| Top-7 Bondholders | ||||
| Sammons Enterprise Group | 64 | NA | No | |
| Icici Prudential AM | 60 | NA | No | |
| DSP BlackRock IM | 60 | 1 | No | |
| BlackRock | 56 | 1 | No | |
| Reliance Capital Trustee | 45 | NA | No | |
| Cohen & Steers | 43 | NA | No | |
| Pacific Employers Insurance | 35 | NA | No | |
| Loans | ||||
| HSBC facility | 1,000 | 4 | Yes |
Private equity is still relatively small, but growing; more transparency is needed on ESG, NDPE and financing. Private equity involvement in the corporate world and in FMCG companies’ ownership is still relatively small. Nonetheless, with the growth drivers intact, private equity’s role has ample room to grow. However, private equity often lacks ESG and forest or NDPE policies. Private equity is financed by rich private individuals (HNWIs), institutional investors, pension funds and banks. These parties provide the equity part and/or the loans and bonds to private equity. The lack of transparency of these financial relations need intensive research. At this moment, financiers might face much higher deforestation risks than they are aware of.
Figure 10: Scores from 0 (least) to 5 (best) forest and palm oil policies based on Forest500 for listed and private companies and cooperatives.
Appendix: Underlying Data of Figure 4
| 2016 turnover USD bn | 2014 Forest 500 score | 2017 Forest 500 score | 2017 Forest 500 palm oil | Ownership
L = listed P = private |
|
| Largest companies (#6) | |||||
| Nestlé | 87.9 | 5 | 5 | 5 | L |
| Johnson & Johnson | 71.9 | 3 | 2 | 5 | L |
| ADM | 67.7 | 0 | 2 | 5 | L |
| P&G | 65.3 | 4 | 4 | 5 | L |
| PepsiCo | 62.8 | 5 | 5 | 5 | L |
| Unilever | 54.9 | 4 | 4 | 5 | L |
| Sub-average | 3.5 | 3.7 | 5.0 | ||
| Large companies (#25) | |||||
| Bunge | 43.5 | 2 | 4 | 5 | L |
| Mars | 33.0 | 2 | 4 | 5 | P |
| L’Oréal | 27.3 | 5 | 5 | 5 | L |
| Kraft Heinz | 26.5 | 0 | 2 | 5 | L/P |
| Mondelez Int | 25.9 | 2 | 2 | 5 | L |
| Danone | 23.1 | 4 | 4 | 5 | L |
| WH Group | 21.5 | 0 | 2 | 0 | P |
| Henkel | 19.7 | 2 | 4 | 5 | L |
| Groupe Lactalis | 18.5 | 0 | 2 | 0 | P |
| General Mills | 16.6 | 4 | 4 | 5 | L |
| Colgate Palmolive | 16.0 | 2 | 4 | 5 | L |
| Oetker-Gruppe | 13.3 | 0 | 2 | 3 | P |
| Kellogg’s | 13.0 | 2 | 4 | 5 | L |
| Hangzhou Wahaha | 12.8 | 0 | 0 | 0 | P |
| Grupo Bimbo | 12.7 | 2 | 5 | 5 | L |
| Uni-President Ent | 12.7 | 0 | 2 | 0 | L |
| Reckitt Benckiser | 12.4 | 5 | 5 | 5 | L |
| KAO | 12.3 | 5 | 5 | 5 | L |
| Conagra Foods | 11.6 | 2 | 2 | 5 | L |
| FrieslandCampina | 11.6 | 2 | 2 | 5 | Cooperative |
| Estee Lauder | 11.3 | 2 | 2 | 4 | L |
| Arla | 11.1 | 2 | 2 | 5 | Cooperative |
| Maeiji Holdings | 10.5 | 2 | 2 | 0 | L |
| Ajinomoto | 10.4 | 2 | 2 | 3 | L |
| Ferrero | 10.2 | 2 | 2 | 5 | P |
| Sub-average | 2.0 | 3.0 | 3.8 | ||
| Mid-sized companies (#10) | |||||
| Yamazaki Baking | 9.4 | 2 | 2 | 0 | L |
| Hormel Foods | 9.3 | 2 | 2 | 5 | L |
| Inner Mongolia Yili | 8.8 | 0 | 0 | 0 | L |
| Campbell | 8.1 | 4 | 4 | 4 | L |
| Shiseido Group | 7.6 | 2 | 2 | 4 | L |
| Hershey | 7.4 | 2 | 2 | 5 | L |
| Beiersdorf | 7.2 | 2 | 2 | 4 | L |
| China Mengniu Dairy | 6.8 | 2 | 2 | 0 | L |
| Kerry Group | 6.6 | 0 | 2 | 5 | L |
| Avon | 6.2 | 2 | 2 | 5 | L |
| Sub-average | 1.8 | 2.0 | 3.2 | ||
| Small companies (#17) | |||||
| QP Corp | 4.8 | 0 | 2 | 0 | L |
| Orkla | 4.1 | 2 | 4 | 5 | L |
| Lindt & Sprungli | 3.8 | 2 | 2 | 4 | L |
| Barilla | 3.6 | 2 | 2 | 5 | P |
| Amul | 3.5 | 2 | 2 | 0 | L |
| Yakult Honsha | 3.5 | 2 | 2 | 0 | L |
| Toyo Suisan Kaisha | 3.4 | 0 | 2 | 4 | L |
| Grupo Boticario | 3.2 | 2 | 2 | 0 | P |
| Want Want China | 2.8 | 0 | 0 | 0 | L |
| Bright Food | 2.7 | 0 | 2 | 0 | P |
| AAK | 2.5 | 2 | 2 | 5 | L |
| Natura Cosmeticos | 2.3 | 2 | 2 | 2 | L |
| Calbee | 2.2 | 0 | 2 | 3 | L |
| Intersnack Knabber-Geback | 2.1 | 0 | 0 | 4 | P |
| Yildiz | 1.7 | 0 | 0 | 4 | P |
| VandeMoortele | 1.6 | 2 | 4 | 5 | P |
| Godrej Group | 1.3 | 2 | 2 | 5 | L |
| Sub-average | 1.2 | 1.9 | 2.7 |
Sources: Global Canopy Programme, Chain Reaction Research.