
Driven by the booming global meat industry and growing markets for vegetable oils, soybeans have become the primary protein crop globally. High production growth rates are particularly prevalent in South America, contributing to massive deforestation, biodiversity loss, fires and emission of greenhouse gases. The Matopiba region, home to most of the remaining native vegetation of the Brazilian Cerrado biome, is a hotspot of soy-driven deforestation. It is expected to see substantial future growth in soy cultivation. This paper maps players in the Matopiba soy supply chain, focusing on midstream crushing as well as compound feed and livestock sectors in key soy processing markets. Their soy consumption is connected to considerable deforestation risk.
The Chain Reaction Research consortium conducted a webinar in March 26, 2020 to review the findings of this report and to share the impacts of the growing market for soy from the Brazilian Cerrado. You can watch the recording and listen to audience questions below.
Download the PDF of the report here: Feed and Livestock in Brazil, China, EU Consume Most Cerrado Soy
Key Findings:
- In 2018/19, Brazil produced 123 million metric tons (Mt) of soy or 37 percent of the global total. The domestic market consumed 23 percent: 17 percent for animal feed, 3 percent each for food and biodiesel. The Cerrado biome accounts for 40 percent of Brazilian production. In 2017, 25 percent of Matopiba soy were processed domestically.
- The Brazilian feed and livestock industries are among the largest in the world. Top feed companies BRF, JBS and Aurora Alimentos are also key poultry and pork producers. China is the top importer of Brazilian meat.
- China imports almost half of Matopiba soy. Deficient domestic protein crop production and the U.S.-China trade war are driving imports. China is the largest pork and egg producer and the second-largest poultry producer. Key integrated feed and meat producers include New Hope Liuhe, Wens Food Group and Muyuan Foodstuffs.
- The EU is the second importer of Brazilian soy, driven by its persistent crop protein deficit. It accounted for 17 percent of Matopiba soy exports in 2017. In the feed sector, Dutch companies ForFarmers, Nutreco and De Heus are the largest players. Groupe L.D.C. (FR), Plukon (NL) and Grupo Veronesi (IT) are key poultry meat companies, while Danish Crown (DK), Tönnies (DE) and Coren (ES) are large EU pork meat producers.
- Banks, bondholders and shareholders provide financing in every part of the soy supply chain. Consequently, financiers and investors face business and investments risks from soy-driven deforestation throughout the entire supply chain, providing ample opportunities to engage and/or to divest.
Soybeans: Brazil has become most important soy supplier globally
Soybeans have become the most important protein crop globally. Commercial varieties deliver higher protein yields than most other legumes, oilseeds and cereals. As a result, soy is a key ingredient for livestock feeds, supplying the booming meat industry as well as a source of edible oil and feedstock for biodiesel. Most of the global soybean production is crushed, resulting in two main products: soymeal (78.5 percent) and soybean oil (18.5 percent). Brazil has become the most important soy supplier globally.
Figure 1: Brazilian soy supply chain
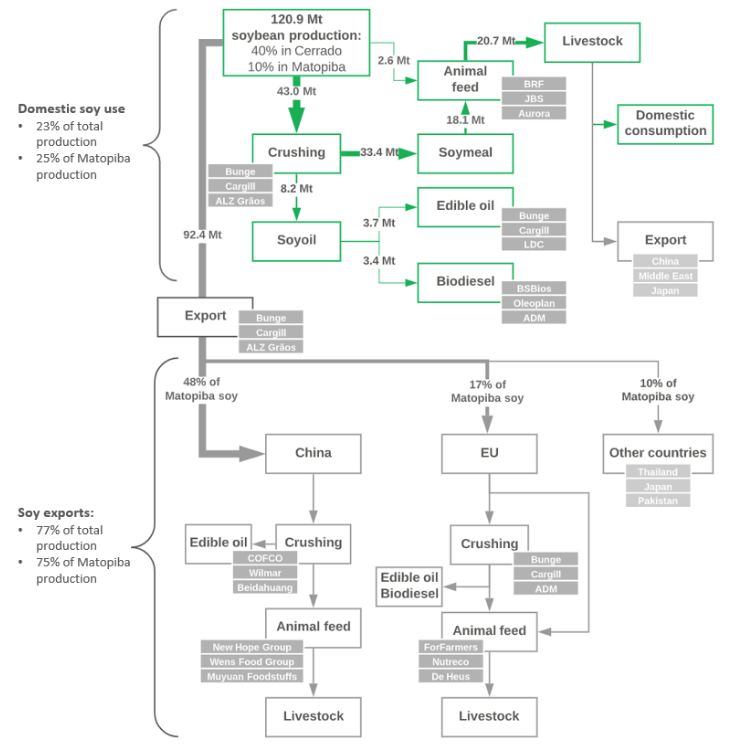
Note: Beginning stocks 2018/19: 32.7 Mt; production: 117 Mt; ending stocks: 28.8 Mt. EU and other countries are partially importing as soymeal that is directly used in animal feed.
Source: Chain Reaction Research based on ABIOVE, 2019; USDA, 2019; Trase, 2018/2019; WATTAgNet, 2019; Feed Strategy, 2019; ANP, 2019; company publications.
Brazil now produces more than one-third of world soybean supplies. While the U.S. has increased production and was the largest soybean producer for many years, South American countries have experienced a much faster growth during the last 20 years, accounting for a combined 57 percent of global production in MY2019/20. Brazil stands out with 123 Mt or 37 percent of the global total (Figure 2).
Figure 2: Global soybean production, 1999 to 2019 (Mt)
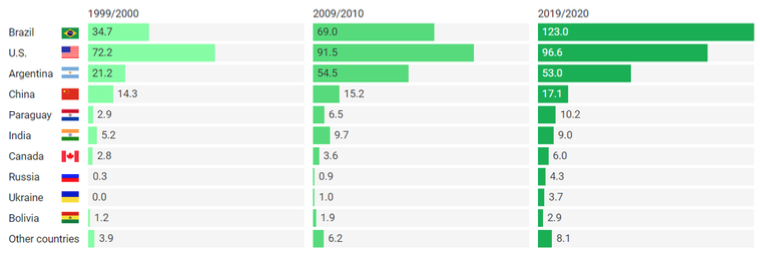
Source: USDA PSD Online, 2019.
Soy is a key driver of deforestation in South American biomes
Cerrado biome a hotspot of soy-driven deforestation in Brazil
The growth of soybeans as a protein and oil crop has been directly and indirectly connected to large-scale deforestation, with high biodiversity losses and emissions of greenhouse gases. Soybean cultivation and cattle ranching are primary drivers of deforestation in tropical forests and savannahs of South America. Large areas of natural vegetation have been converted in valuable biomes. The Amazon Soy Moratorium, which was first agreed in 2006, helped to significantly reduce soy-driven deforestation in the Amazon biome. Conversion in the Amazon biome, including through fires, is now mostly driven by the expansion of cattle ranching. Meanwhile, the Brazilian Cerrado biome has seen increased deforestation for soy cultivation in recent years. While the Forest Code requires farmers in the Amazon to preserve up to 80 percent, farmers are only required to set aside 20 percent of native vegetation across much of the Cerrado. Only about 55 percent of the Cerrado’s native vegetation remains at this point.
Deforestation in the Cerrado, driven in large part by the expansion of soy cultivation, has caused loss of biodiversity and high CO2 emissions, while also disrupting water systems. Annual carbon dioxide equivalent (CO2e) emissions totaled 168 Mt in 2018 and 186 Mt in 2017. Other South American biomes with high rates of soy-related deforestation include, but are not limited to the Gran Chaco biome in Argentina, Paraguay, Bolivia and Brazil, which is considered close to seeing irreversible damage, and the Brazilian Pantanal.
As most soy-driven deforestation in the Cerrado is legal, it is the most likely location for expected growth of soy cultivation in Brazil. The current hotspot is the Matopiba region in the northern Cerrado, where most of the Cerrado’s remaining native vegetation resides. At the same time, deforestation rates there are higher than in many other regions of Brazil (Figure 3).
Figure 3: Deforestation in the Brazilian Cerrado and Matopiba region, 2009-2019
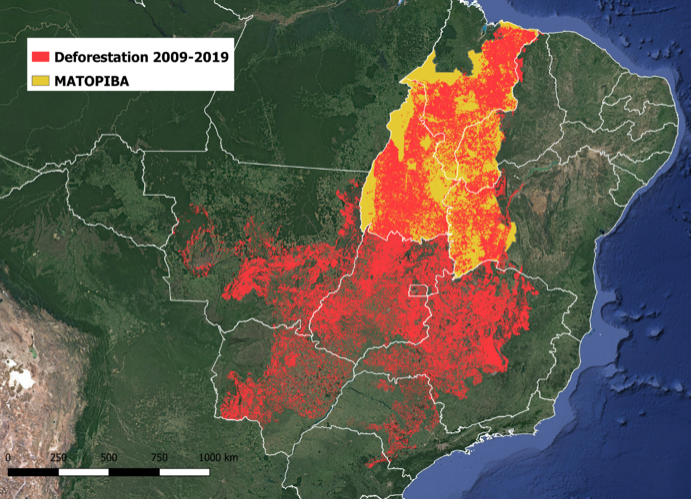
Source: Chain Reaction Research, based on Prodes (2009-2018) and Deter (2019).
Of the total area of native Cerrado vegetation cleared for soy cultivation between 2005 and 2016, 76 percent occurred in Matopiba. A broad coalition of large food companies with exposure to the soy and beef supply chain, as well as a coalition of investors, support the 2017 Cerrado Manifesto, which calls for adopting policies to halt legal and illegal deforestation. However, efforts to implement a system to compensate farmers for preserving areas that they could otherwise cultivate stalled for two years, as stakeholders could not reach an agreement on who would provide funding. On December 6, 2019, three European companies were the first to announce financial support for the “Funding for Soy Farmers in the Cerrado” initiative. British retailer Tesco committed USD 13M, Dutch animal feed producer Nutreco USD 1M and Norwegian salmon farmer Grieg Seafood USD 2 per ton used. Meanwhile, a 2019 analysis by Soterroni et al found that an agreement for zero native vegetation conversion in the Cerrado could avoid the loss of 3.6 million ha of native vegetation to soybeans by 2050.
Traders face financial risk from exposure to deforestation-linked Cerrado soy
The Bolsonaro government in Brazil favors the expansion of large-scale agriculture over forest protection and encourages moves to weaken environmental protection efforts in favor of agribusiness. Recent developments include an announcement in early November 2019 by Brazilian farmers, represented by soy producer association Aprosoja Brasil, and supported by the federal government, to start a campaign to eliminate the Amazon Soy Moratorium. This development is taking place even though scrapping the Amazon soy moratorium would put at least the USD 5 billion European Union (EU) market for Brazilian soy at risk. The Brazilian grain exporters association, ANEC, which represents the major soy traders, published a statement stressing that global grain traders are opposing a ban on soy purchases from newly deforested areas in the Cerrado. Meanwhile, the Brazilian Association of Vegetable Oil Industries (ABIOVE), which also counts the leading oilseed traders among its members, wants to keep the Amazon moratorium in place and participates in discussions on how to eliminate soy-driven deforestation in the Cerrado.
Among the ANEC and ABIOVE members are the major soy traders from the Cerrado, ADM, Amaggi, Bunge, Cargill, COFCO and LDC. These traders are involved at various stages of the Brazilian supply chain, as aggregators operating silos in soy production regions, crushers, edible oil and biodiesel producers, infrastructure operators and exporters. Facilities in Cerrado states accounted for a combined share of 57 percent of domestic crushing capacity in 2016 (Figure 2).
The major traders all support the Amazon Soy Moratorium and have made global commitments to zero deforestation that apply to the Cerrado. As members of the Soft Commodities Forum (SCF), these companies also committed to a common framework for reporting and monitoring progress on transparent and traceable soy supply chains for soy in the Cerrado. However, the pledges remain vague in relation to their commitments to exclude conversion of all native Cerrado vegetation and implementation of effective non-compliance mechanisms. None of the traders support the Cerrado Manifesto. As CRR previously reported, the traders’ deforestation policies may be insufficient in mitigating deforestation risk. As a result, they may face revenue-at-risk, financing risk, and reputation risk from exposure to deforestation in their supply chains.
In the mid- and downstream industries, a wide range of processing companies have become dependent on soy supplies from Brazil. Consequently, companies involved in the manufacture of animal feed, livestock products, biodiesel and edible oil are exposed to risks from deforestation-linked soy in their supply chains.
Brazilian domestic soy supply chain
Twenty-three percent of Brazilian soy production processed domestically
In total, approximately 23 percent of the Brazilian soy harvest is consumed domestically. In 2018/19, soymeal for animal feed accounted for 17 percent, food use of soybean oil for 3 percent and biodiesel for 3 percent (Figure 1). The remaining 77 percent was exported, with China and the EU as main destinations.
The Cerrado Biome accounted for 40 percent of the total Brazilian soy production in 2017. For domestic consumption, the share of Cerrado soy stood at 51 percent. In total, 15.6 Mt of soy produced in the Cerrado were processed domestically in 2017. The share of Cerrado soy exported by leading traders varied between 19 percent and 46 percent (Figure 4).
The four states that make up the Matopiba region of the Cerrado accounted for only 10 percent of total Brazilian soy production in 2017, but saw the highest risk of deforestation. Twenty-five percent of the Matopiba soy production was consumed domestically, representing 10 percent of the overall Brazilian soy consumption. Matopiba has considerable potential for further soy expansion, benefitting from a favorable farm structure and efficient logistics. Key soy traders from Matopiba in 2017 included Bunge (12.5 percent), Cargill (12.1 percent), ALZ Grãos (an origination and commercialization JV between Amaggi, Louis Dreyfus Company and Zen-Noh Grain Brasil) (10.0 percent) and ADM (7.8 percent).
Figure 4: Soy crushing capacity in Brazilian states (2016, tons/day), and share of Cerrado soy in sourcing of leading traders (2017, Mt)
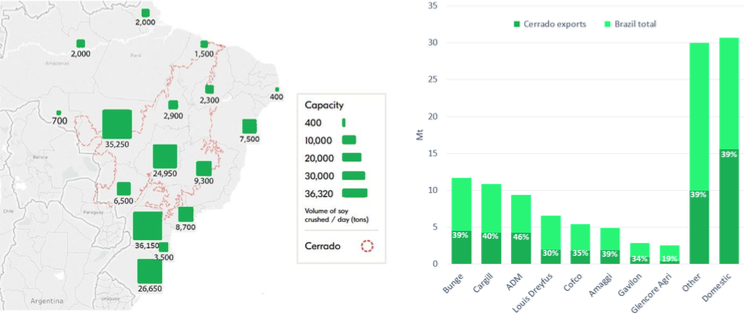
Source: Trase, 2018/2019.
With 5.3 billion liters sold in 2018, Brazil’s biodiesel market is second only to the U.S. In the most recent available five-year data (2012-2016), soybean oil accounted on average for 77 percent of Brazilian biodiesel feedstock. The remainder is mostly animal fats with an average of 18 percent.
Figure 5: Brazilian soy crushers’ production by sector, 2018
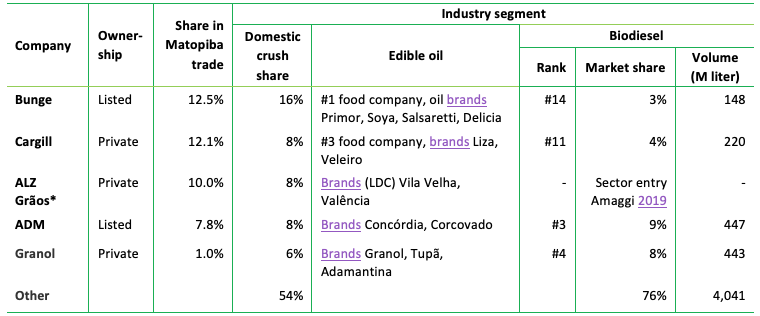
*JV between Amaggi, Louis Dreyfus Company, Zen-Noh.
Source: Trase, 2018; BMI Industry Reports, 2019; ANP, 2019; company publications.
Brazil holds a global top position in feed and livestock production
The Brazilian feed industry is the third largest in the world, driven by the country’s size and its population, high consumption of meat, and large meat export volumes. Total domestic livestock feed production in 2018 was 70 Mt, with poultry and pig feed as the key sectors (Figure 6). The 21 Mt of soy (18.1 Mt soymeal plus 2.6 Mt soybeans) processed into animal feed in Brazil in 2017 were a key source of high-quality protein in compound feed. Typically, the share of soymeal is highest in feed for broilers and layers, followed by pig feed and a smaller share in dairy cattle feed. It can thus be assumed that poultry feed accounts for a larger share in the soy volume processed in feed than the sector’s 55 percent share in overall compound feed production.
Figure 6: Share of different livestock feeds in Brazil, 2018, and livestock production, 2018
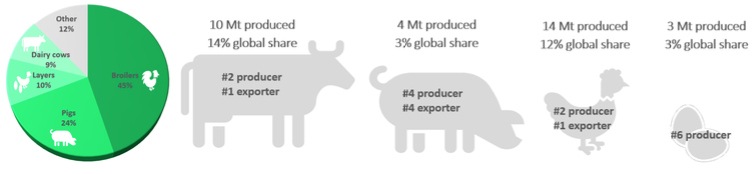
Source: All About Feed, 2019; FAOStat, 2019.
The Brazilian poultry and pork sectors are characterized by a high level of integration. The top-3 Brazilian animal feed producers (Figure 7), BRF, JBS and Aurora Alimentos, are all also leading meatpackers. They account for a combined share of 21 percent of domestic feed production. Leading poultry and pork companies provide farmers with all inputs, including animal feed. In return, farmers deliver livestock for slaughter exclusively with these companies.
Figure 7: Top-3 Brazilian feed producers, 2018
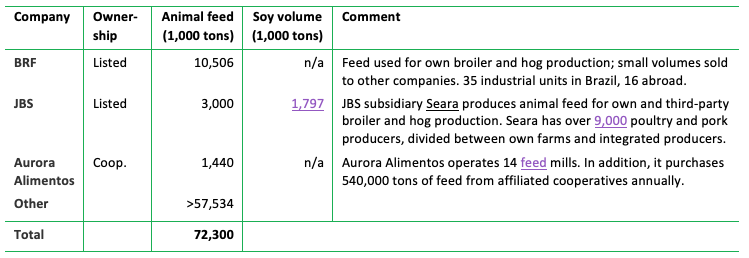
Note: includes feed production in Brazil as well as in foreign operations.
Source: WATTAgNet, 2019; Feed Strategy, 2019; company publications.
Brazil has one of the world’s largest livestock sectors and a high per capita meat consumption. Compared with its share in global population (3 percent), the country’s role is particularly important in beef (14 percent of global total) and broiler chicken production (12 percent). Approximately 80 percent of beef, 72 percent of poultry meat and 81 percent of pork are consumed domestically. Poultry is the most important Brazilian meat export, accounting for around 28 percent of production. Dairy and eggs are predominantly consumed domestically.
Brazil is the second largest producer and the largest exporter of poultry globally, serving all regions of the world. Furthermore, it ranks fourth on both production and exports of pork globally and second after the U.S. for beef production, while it is first in beef exports. Intensive beef farming with the addition of pre-mixed compound feeds is also expanding in Brazil. However, cattle are still largely grass-fed. Brazil’s pork production grew by 20.1 percent (to 3.63 Mt) over the last decade, with an increase of 22 percent in exports (to 645,500 Mt or 18 percent of production). Meanwhile, poultry production increased by 50 percent. The poultry sector includes a small number of large players, namely BRF with its Sadia and Perdigão brands and JBS’ Seara, which have a combined share of 48 percent of slaughter. The remainder of the sector is fragmented among many smaller players. Brazilian BRF is also the world’s largest chicken exporting company. Figure 8 lists leading Brazilian meat producers and exporters.
Figure 8: Top pork, poultry and dairy producers in Brazil, 2018 (heads slaughtered/liters milk/ layers)
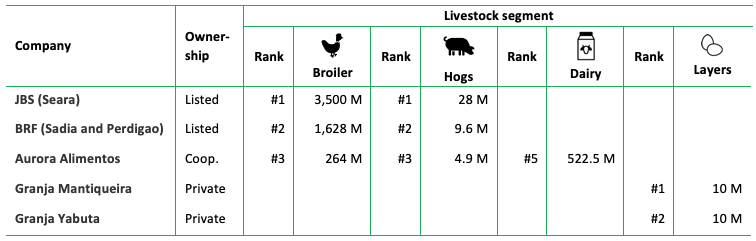
Source: WATTAgNet, 2019; Poultry International, 2019; Pig Progress, 2019; Scot Consultoria, 2019, company publications.
Retailers are the most important channel for food sales in Brazil. In 2018, they were responsible for 67 percent of domestic sales, suggesting a similar share for sales in the livestock product segments. The food service channel accounted for 33 percent of food sales (EMIS Insights, 2019).
Figure 9: Export destinations of Brazilian poultry, pork meat, 2018 (Mt)
Source: ITC Trademap, 2019.
Key export markets for Matopiba soy
Sixty-six percent of Cerrado and 75 percent of Matopiba soy production is exported
Most Brazilian soy production is exported to international markets, with China as key destination. Most of the harvest is exported as soybeans (63 percent in 2018), largely driven by China’s imports of soybeans for domestic crushing (Figure 10). This relationship has been further tightened by the U.S.-China trade war, which caused U.S. soy exports to China to drop to almost zero in 2018. Amid ongoing negotiations, U.S. exports to China have rebounded in recent months. However, they remain far below earlier years, and further developments remain unpredictable.
Figure 10: Brazilian soy export destinations, 2018
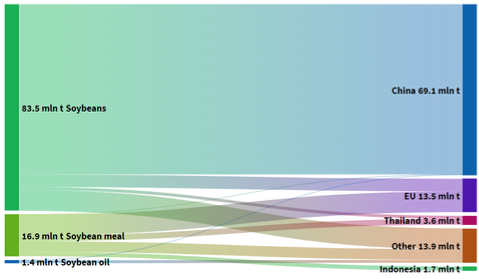
Source: ITC Trademap, 2019. Note: Soybean meal includes soy protein concentrate used in aquaculture feed.
China is also the key importer of soy produced in the Matopiba region of the Cerrado, receiving 48 percent of the Matopiba soy in 2017. An estimated 5.6 Mt, or 10 percent of the Brazilian soy exported to China, were sourced from Matopiba municipalities in 2017. As the total volume of Brazilian soy exported to China increased in 2018/19, this volume likely has increased further.
Other large importers of soy from Matopiba are the EU member states, accounting for 17 percent of the soy produced in these Cerrado states in 2017, followed by Thailand and Japan with 2 percent each. These top destinations in combination with Chinese imports and Brazilian domestic consumption accounted for around 11 Mt or 94 percent of Matopiba production in 2017. Figure 11 illustrates trade flows from Matopiba States in 2017, adjusted to reflect the soy-driven deforestation risk in these trade relationships and show the high exposure of China and EU countries.
Figure 11: Export destinations of Matopiba soy considering soy-driven deforestation risk, 2017
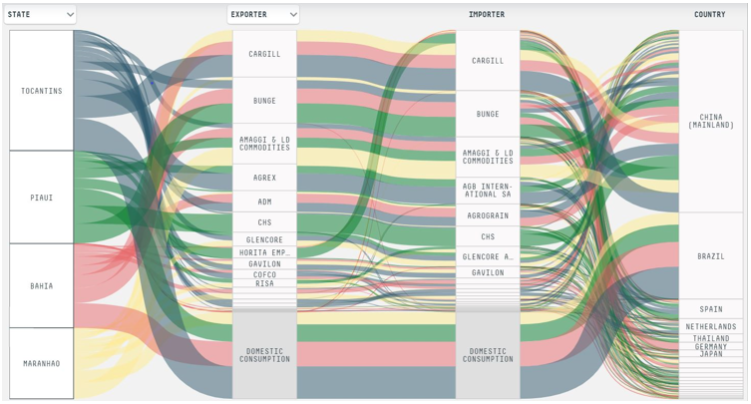
Source: Trase, 2019. Note: Deforestation risk is calculated as an annual average surface based on soy-related deforestation over a five-year period, allocated in proportion to volumes sourced from certain jurisdictions.
China: 58 percent of Brazilian soy production, leading role in Cerrado exports
China is by far the largest market for soy globally, with imports accounting for around one-quarter of global production in 2018. China imported a total of 88.1 Mt of soy at a value of USD 38.1 billion in 2018, mostly in the form of soybeans for domestic crushing. Imports have more than quadrupled in the last 20 years, making it the single largest agricultural commodity by value imported to the country. This dependence on imports is driven by insufficient domestic production due to land degradation and water scarcity, in combination with a growing population and economy that are accompanied by increased livestock product consumption.
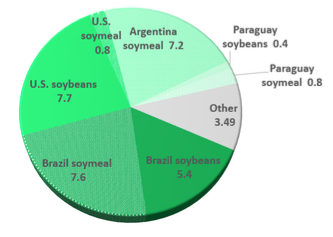
In 2018, the share of Brazilian soy in China’s imports further increased to 75 percent of the total, driven by the ongoing trade war with the U.S. Soybean imports are forecast to reach 91.5 Mt in MY2019/20, a year-on-year (y-o-y) increase by 4 percent. This volume, however, would still be lower than the MY2017/18 imports of 94.1 Mt. The decrease has been driven by lower feed demand caused by African swine fever (ASF) and the new feed standard approved by the China Feed Industry Association in October 2018. The organization introduced a lower minimum requirement for crude protein and a maximum protein level. While Trase has no 2018 figures yet available, 2017 figures show that soy from Matopiba makes up an estimated 10 percent of China’s imports from Brazil. China also imports soy from other South American countries with high soy-driven deforestation rates, namely around 1.5 Mt from Argentina in 2018 (Figure 12).
Figure 12: Origins of total soybean imports to China, 2018
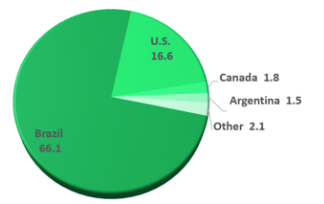
Source: ITC Trademap, 2019.
China almost exclusively imports soybeans for domestic crushing, but patterns are changing. In line with the growing need for feed protein for livestock production, China has expanded crushing capacity in recent years, which explains the preference for bean imports. Meanwhile, the China-U.S. trade war and the subsequent search for alternative supplies drove the recent approval of soymeal imports from Argentina. China is reportedly also in talks with Brazil for a similar agreement, which could further increase imports from regions with high deforestation risks, like the Cerrado and the Gran Chaco.
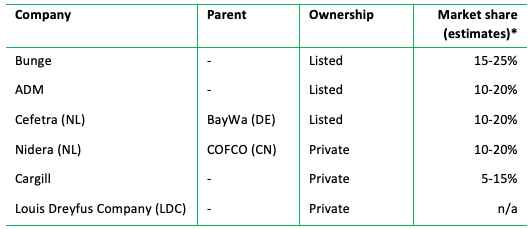
State-owned and other Chinese companies dominate the import and crushing of soybeans. Between 2015 and 2017, state-owned companies accounted for 31 percent of imports, other Chinese companies for 40 percent and foreign companies for 27 percent. Similarly, approximately 60 percent of the domestic crushing industry is controlled by Chinese companies. Large international players control the remaining 40 percent. While most crushers are also leading importers, some processors buy soybeans for crushing imported by other sector players. The largest players in the crushing industry based on 2017 data are listed in Figure 13. They are also leading producers of edible oil. Soybean oil is the most important edible oil on the Chinese market with a total consumption of 16.5 Mt in 2018/19.
Figure 13: Top soybean crushing industry players in China, 2017
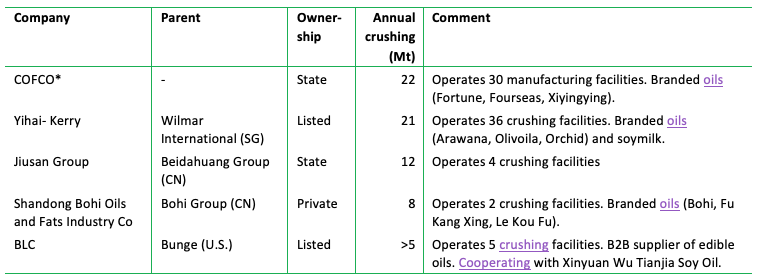
Source: USDA ERS, 2019; Solidaridad, 2017; company publications. Note: *including Chinatex and Noble Agri.
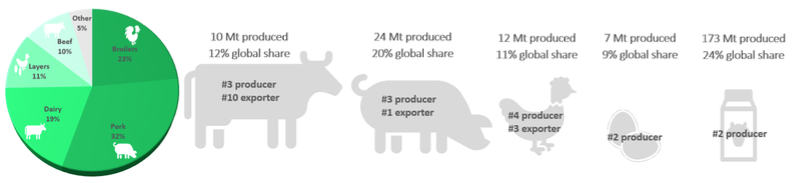
China is the largest animal feed producer globally and among the top-3 largest meat producers across all key livestock segments (Figure 14). China’s animal feed production reached 187 Mt in 2018, or 17 percent of the global total. In the meat sector, China is the global leader in pork production and holds the second place in poultry. The country’s production volume and global share in the pork market, however, has declined in the last two years due to the ASF outbreak. China’s livestock production is almost exclusively consumed in the domestic market.
Figure 14: Share of different livestock feeds in China and livestock production, 2017
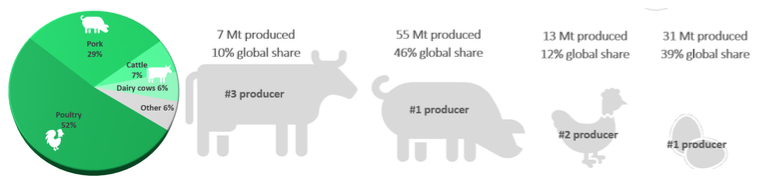
Source: Solidaridad, 2017; FAOStat, 2019.
The three largest feed producers accounted for 20 percent of domestic feed production in 2018 (Figure 15). It is not known how much soy individual companies use in their mixes. While the trend towards integrated feed production by large livestock companies is growing, as in the case of Wens Food Group and Muyuan Foodstuffs, it still accounts only for a small market share. The largest share of feed is still self-produced by farmers. While around 97 percent of broiler feed comes from industrial feed, this share reaches only 37 percent for hogs, 43 percent for layers and 25 percent for aqua feed.
The three leading feed companies are also among the leading Chinese meat producers (Figure 16). In the important hog production sector, concentration is a persistent trend, driven also by the outbreak of ASF. Market analysis expect the top-2 producers, Wens Food Group and Muyuan Foodstuffs, to expand hog output by 100-200 percent by 2025. However, Wens Food Group, the largest hog producer, still only holds a 3 percent market share, followed by Muyuan Foodstuffs with 2 percent, illustrating the sector’s fragmentation.
Figure 15: Top-3 compound feed producers in China, 2018
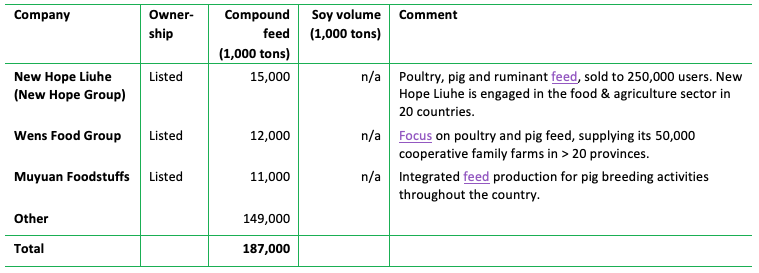
Source: WATTAgNet, 2019; Feed Strategy, 2019; company publications.
Figure 16: Top pork and poultry producers in China, 2018 (broiler heads slaughtered / hog heads sold / layers)
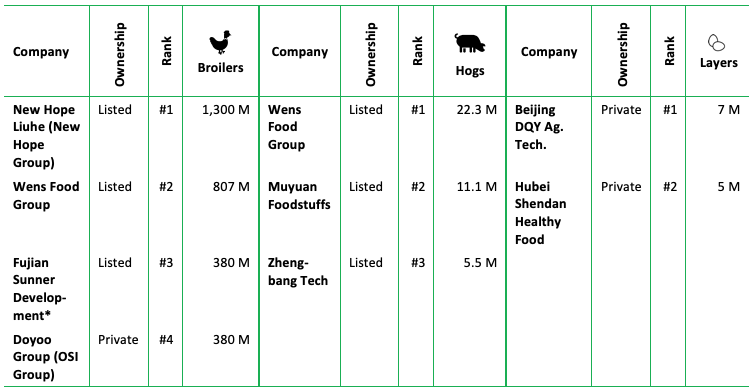
Source: China Galaxy International, 2019; Poultry International, 2019; WATTAgNet, 2018; company publications. Note: *Fujian Sunner Development supplies McDonald’s, KFC, Walmart, Metro.
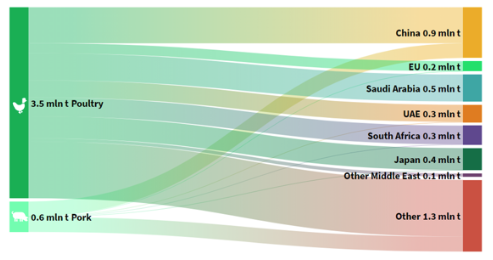
Next to its leading role as an importer of Brazilian soy, China is also a major importer of meat. Therefore, it is a recipient of high volumes of embedded soy. In addition to domestic production of 55 Mt of pork in 2018, the country imported another 1.3 Mt. Key trade partners for pork are the EU, Canada and Brazil (Figure 17). Domestic poultry production has increased since the outbreak of ASF, reaching 12 Mt in 2018. Poultry imports totaled 0.5 Mt, with Brazil as the key origin, accounting for 84 percent of imports. Chinese meat imports are expected to further increase in the light of tighter domestic pork supply.
Figure 17: Key origins of pork and poultry imports to China, 2018 (Mt)
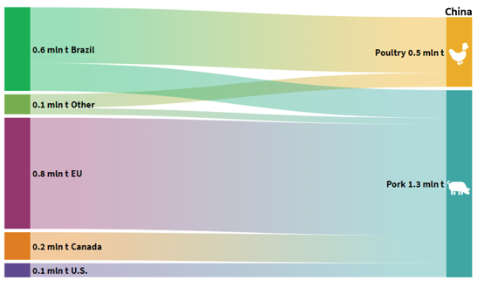
Source: ITC Trademap, 2019.
In China, independent food and drink shops are still holding the largest share among livestock product sales channels with a 57 percent share in value in 2018. Supermarkets are the second largest with 30 percent of the value share (Marketline, 2019).
European Union – Low self-sufficiency rate for crop proteins leads to large soy imports
The 28 EU member states all combined are the second largest import destination for soy globally. In 2018/19, the EU accounted for 30 percent (18.6 Mt) of soymeal imports and 10 percent (15.1 Mt) of soybean imports globally. Due to a considerable plant protein deficit, the EU is highly dependent on soy imports from non-member countries for its livestock sector.
Brazilian soy accounted for the largest share of imports to the EU, with a combined total of 13 Mt of beans and meal in 2018 (Figure 18). The EU was also the second largest importer of soy from Matopiba based on 2017 figures, accounting for a share of 17 percent of production. Additionally, the EU imports soy from other origins with high risk of soy-driven deforestation, namely Argentina and Paraguay.
Most soy volumes shipped from Matopiba to the EU entered through Spain, Germany and the Netherlands in 2017. Germany and the Netherlands are both important transshipment countries: the Netherlands re-exported 61 percent of total available soymeal from import and crushing, and Germany re-exported 30 percent. As no traceability data is publicly available on the share of Brazilian soy re-exported to other countries, it is unclear which countries processed most of it. Spain, the leading EU importer of Matopiba soy, re-exports comparatively small amounts (7 percent in 2017) of the soy volumes it receives.
Figure 18: Origins of total soybean and soymeal imports to EU member states, 2018
Source: Eurostat, 2019.
The crushing sector in the EU is dominated by the leading international oilseed traders, which also play an important role in origination and export from key soy-producing countries (Figure 19). In individual member states, other crushing companies may have a substantial domestic market share, such as Louis Dreyfus Company in France (10-20 percent for soymeal).
In 2018, 680,000 tons of soybean oil were used in biodiesel in Europe. This share made up 5.5 percent of the total feedstock. Other uses of soybean oil included food, feed and other technical applications.
Figure 19: Top soybean crushing industry players in the EU, 2017
*Market shares based on estimates by the European Commission. Estimates include a combined share in the soymeal market of 20-30 percent (with 0-5 percent increment) for Bunge and Cargill, after Bunge’s acquisition of two of Cargill’s crushing facilities in Europe. Source: EU Commission, 2017; Chain Reaction Research.
The EU is among the leading livestock producers globally. It has a large share in the pork and dairy markets (Figure 20).
Figure 20: Share of different livestock feeds in the EU and EU livestock production, 2017
Source: FAOStat, 2019; PSD Online, 2019, FEFAC, 2018.
Figure 21: Estimated distribution of EU soy consumption across livestock segments, 2017
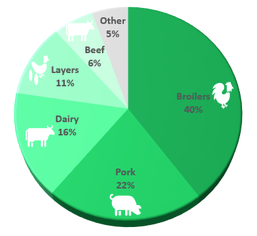
Source: IDH & IUCN, 2019; Hoste,R., 2016.
Among the top-5 EU feed companies, four are headquartered in the Netherlands, with operations expanding to European and international markets (Figure 22). Only a few of the companies publish figures on processed soy volumes. These five companies account for less than 23 percent of total volumes, illustrating the market’s fragmentation.
Figure 22: Top-5 European compound feed producers, 2018
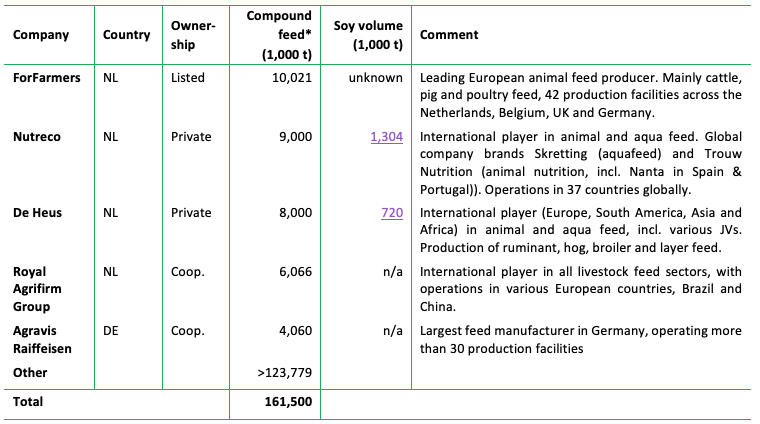
Source: Feed Strategy, 2019; company publications. Note: *Figures include volumes produced outside of the EU.
Based on total net imports of soymeal, the largest markets for soy animal feed are Spain, Germany, Italy, France and Poland with a combined share of 55 percent (Figure 23). In 2017, Spain had the seventh largest compound feed market in the world.
Figure 23: Top soymeal consuming EU countries, 2017
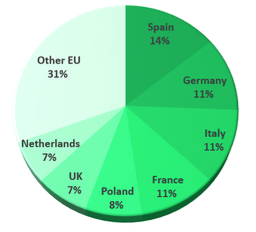
Source: Eurostat, 2019; Oil World, 2018.
Figure 24 shows the top-5 companies in the key soy-consuming sectors in the EU.
Figure 24: Top-5 pork, poultry and dairy producers in Europe, 2017/18 (heads slaughtered / ME* intake/ layers)
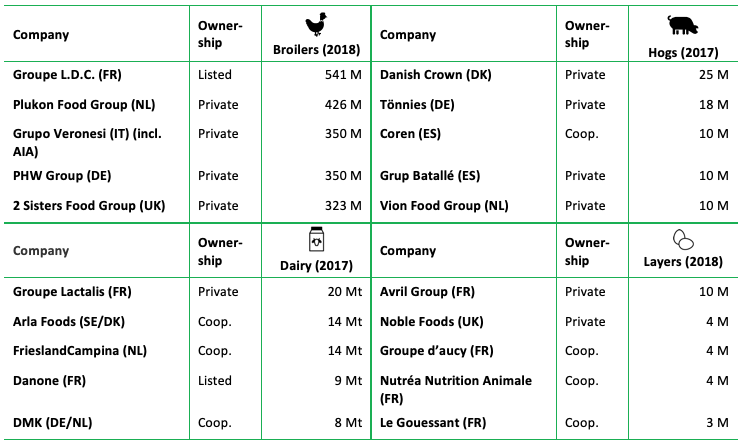
Source: Poultry International, 2019; Pig International, 2017; IFCN Dairy, 2018. Note: *ME=Milk Equivalent.
The EU member states also import embedded Brazilian soy in livestock products. The share of embedded soy is particularly high in poultry and pork. While large volumes of these products are traded within the EU, imports from outside the EU are comparatively small and concentrated on a small number of origins. Extra-EU pork imports are negligible at less than 1 percent of EU consumption and predominantly originate from other European countries. In the poultry segment, the EU imported 528,000 tons in 2018 (4 percent of EU poultry consumption), of which 42 percent originated from Thailand, 30 percent from Brazil and 20 percent from Ukraine. These imports consisted of prepared or preserved and frozen poultry.
Supermarkets are the key sales channel for livestock products in Europe. In meat sales, 69 percent of sales by value were channeled through supermarkets and hypermarkets in 2018, while food specialists accounted for 20 percent of sales (Marketline, 2019).
Thailand, an important origin of embedded soy in EU poultry imports, is exposed to the fourth-highest risk from soy-driven deforestation in Matopiba (Figure 11). Brazil was the most important supplier of soy to Thailand in recent years. In 2017, the country received a total of 3.6 Mt of soy from Brazil in 2017, of which 56 percent (2.0 Mt) originated from the Cerrado and 6 percent (212,000 tons) from Matopiba. In Thailand’s livestock sector, poultry (broilers and ducks) consumed 39 percent of total animal feed, followed by pigs with 33 percent (Figure 25). As soy percentages are highest in poultry feed, the segment’s share in total soymeal consumption in Thailand was even higher at 48 percent. Pigs accounted for 28 percent of soymeal consumption and layers for 17 percent.
Figure 25: Production share of different animal feed sub-sectors in Thailand and use of soymeal, 2018
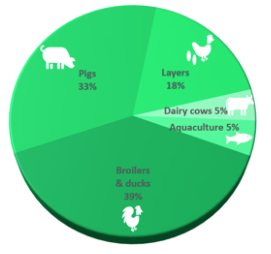
Source: Thai Feed Mill Association, 2019.
Thailand has shown strong growth rates in chicken exports in recent years and leads the ranking of exporting countries in terms of proportional growth. The growth trend is expected to continue as farm productivity is improving, animal disease and food safety controls are tightened, and more advanced end-products are developed.
Five companies, which are responsible for 70-75 percent of the total export production, dominate Thailand’s poultry export production. The largest producers are Charoen Pokphand Group (CP, the sixth largest broiler company globally), Betagro, Saha Farm and GFPT. Moreover, most of these companies have implemented fully vertically integrated farming. In poultry processing, major foreign companies are active in Thailand. These firms include Cargill (U.S.), Ajinomoto and Nipponham from Japan, Invivo (France), Cheil Jedang (South Korea) and Tyson Foods (U.S.), which acquired the Thai and European poultry businesses from BRF (Brazil) in June 2019.
Banks, bondholders and shareholders provide finance throughout the entire soy supply chain
Due to their broad involvement, financers and investors face business risks and investment risks from soy-driven deforestation throughout different stages of the soy supply chain. This wide exposure provides ample opportunities to engage and, in the case of insufficient action, to divest.
- Downstream/FMCG companies, including food retailers, restaurant chains, food companies and home & personal care companies, are most exposed to reputation This risk could lead to a material impact on the market capitalization of a company. Market access risk could also have a high value. Financing risk is more limited in size, on average. As most consumer-facing companies are members of the Consumer Goods Forum, they may face conflicts with zero-deforestation commitments from 2020 onwards. These downstream players are financed by a wide range of shareholders and bondholders as well as banks, which all could start to engage. European financers may be first to engage as a number have zero-deforestation policies.
- Soy traders could face market access risk from lagging zero-deforestation policies, as well as financing risk. Stranded asset risk is limited. As all large traders are lagging in policies, their customers (animal feed companies, FMCGs) have difficulty in avoiding the traders’ insufficient deforestation policies. As all traders are highly dependent on bank loans and other financial services, often from European banks with zero-deforestation policies, the banks may use their high leverage to engage.
- Soy-producing companies face market access risk, financing risk and stranded asset risk from deforestation, while European financers face reputation risk. Farmers are often financed by local Brazilian banks, local affiliates of international banks and barter agreements with soy traders. Large farmers are also financed by international banks and shareholders. Several of the financers, notably the ones based in Europe, could face reputation risk from deforestation.