The palm oil value chain contains a number of stakeholder groups, such as smallholders, large plantations, refineries, the fast-moving consumer good (FMCG) industry, the oleochemical and pharmaceutical industry, and the retail and food service sector. In every step of the chain, palm oil is further processed or is embedded in products which contain other ingredients, like hazelnut pasta or shampoo. Transparency on the distribution of financial benefits producing and processing palm oil is crucial. Transparency could enable stakeholders’ discussions on the fairness of costs and expenses related to ESG and zero-deforestation policies, the cost of reforestation/restoration, monitoring, and verification.
Download the PDF here: FMCGs, Retail Earn 66% of Gross Profits in Palm Oil Value Chain
See a recorded presentation covering the main findings below:
Key Findings:
- FMCGs and retail generate 66 percent of the gross profit and 52 percent of the operating profit in the palm oil value chain. However, market fragmentation is large. The top five FMCGs use 3.4 million metric tons (MT), or 6 percent of palm oil embedded in food and contribute 11 percent of gross profit in the group. Fragmentation in retail is even larger.
- Although smallholders generate USD 17 billion, which is 6 percent of the entire chain, their share in profits is close to zero. Large plantations own mills and might be further integrated. Their share in the value chain is 14 percent, 13 percent in gross profit, and 23 percent in operating profits.
- The refinery sector generates a quarter of the value and nearly one-fifth of profits. Refineries for consumer products make up two-thirds of this group, while biodiesel refineries have grown to a third.
- Oleochemicals and food ingredient specialists account for small contributions. Around six million tons of embedded palm oil is processed in this sector.
- The top 11 companies in the palm oil chain are linked to 50 percent of the global palm oil volume and generate 12-15 percent of profits. Wilmar, PT Pertamina, Unilever, PepsiCo, AAK, Sime Darby, Procter & Gamble, Golden Agri-Resources, Astra Agro Lestari, McDonald’s, and Walmart generate USD 6.1 billion in gross profit in embedded palm oil.
- FMGCs could pay for zero-deforestation efforts with a two percent price increase in palm oil-based products. The price increase would include planting costs and cash flow support for smallholders and NDPE execution, along with monitoring and verification costs.
Profit and value chain analysis in palm oil
In commodity supply chains, the value of the processed material has been rising in every stage of the chain. The value contribution and the profits of each stage depends on the complexity of the process and the market position of a company. Consequently, the various stages in a supply chain generate many different proceeds and profits on the (embedded) palm oil. Understanding the money trail in the palm oil supply chain provides new insights about value risks for the various actors in case of sustainability risks. Also, knowledge of the financial benefits might feed the discussion about the distribution of costs related to the implementation, execution, monitoring and verification of NDPE policies.
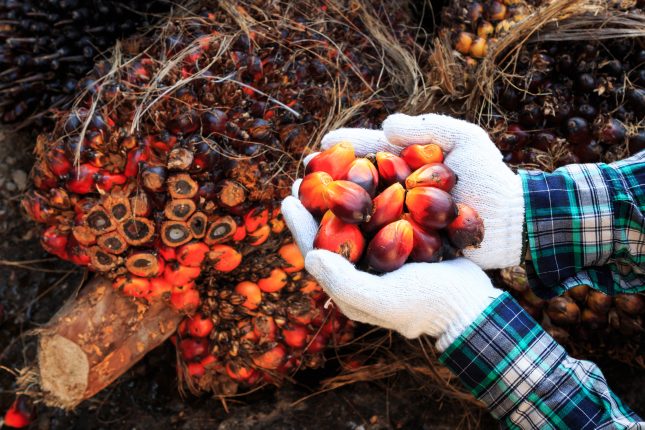
Oil palm is a perennial tree crop. Fresh fruit bunches (FFBs) are milled into 20 percent crude palm oil (CPO), 2-3 percent palm kernel oil (PKO) and 2-3 percent palm kernel meal. CPO is highly standardized in terms of quality. Global CPO production in 2020/21 is expected to total 75.6 million MT. PKO is oil extracted from the kernel, and global production size is expected to be approximately 8.77 million MT in 2020/21, 12 percent of the size of CPO production.
Figure 1: Supply chain of palm oil
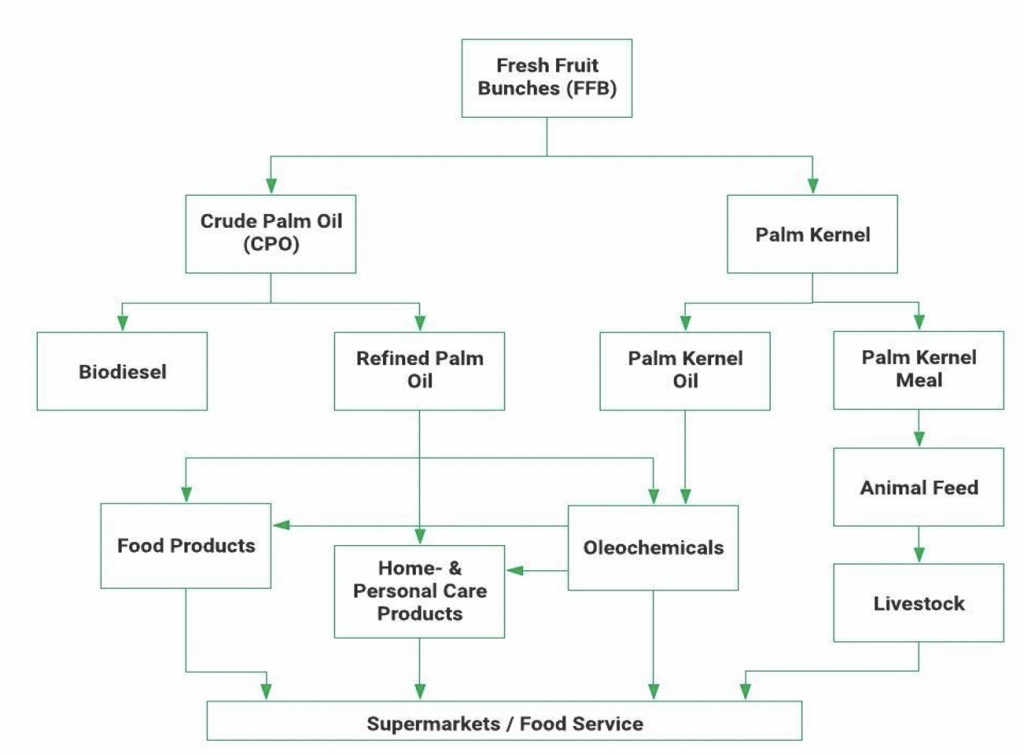
Source: Chain Reaction Research, based on Byerlee, Falcon and Naylor (2018), “The Tropical Oil Crop Revolution.”
After production, the next step is refining the product. A portion of the refining business makes biofuels, but the major part of refining palm oil is for other applications. About 75 percent of processed palm oil is used for food products, such as cooking oil, margarines, and ingredients in a wide range of processed foods like sauces, chocolate, ice-cream, and hazelnut chocolate paste. Palm oil is also processed in non-food products for the home and personal care (HPC) industry (detergents, soap, cosmetics) and industrial inputs (oleochemicals, pharmaceutical industry). PKO is also used in the HPC industry, and the palm kernel meal (the remaining product of the kernel) is used in animal feed.
Smallholders and palm oil plantations
The upstream part of the palm oil supply chain consists of a combination of a large number of smallholders and large industrial palm oil plantations. The smallholders can operate independent or in a plasma structure, in which they work on a large plantation concession. There are millions of smallholders which earn a modest income through the harvesting of oil palm trees. These smallholders have average areas of nearly three hectares each, which could generate 15 MT to 20 MT of FFB per hectare. Smallholders usually do not have their own palm oil mills, and therefore they send their harvest to mills owned by larger plantations. These larger mills need sourcing from smallholders in order to cover the costs of capital-intensive operations. With a yield of approximately 20 percent, production per hectare can be 3.5 MT, making it approximately 10 MT per smallholder. Consequently, with a palm oil price of USD 754 per MT (2020), the average income for a smallholder is approximately USD 7,540 per year.
In Indonesia, approximately 40 percent of CPO is produced by smallholders, and in Malaysia it is about 10 percent. In Thailand and Papua New Guinea (PNG), smallholders produce respectively nearly 100 percent and 40 percent of national CPO output. Smallholders lack the economic scale to generate the same profit margins as large plantation companies, but data suggest that they generate the same price level per produced metric ton of CPO. With Indonesia being the dominant producer of palm oil, approximately 30 percent of global palm oil will be produced by smallholders. These generate the above-mentioned USD 7,540 per year income. But with an average household of 4.3, there is a high chance of poverty with this income level. The concepts of “profit” (used later in this research) are not applicable to this group.
In 2019, global production of palm oil totaled 75.6 million MT, of which 57 percent was produced in Indonesia, 26 percent in Malaysia, 4 percent in Thailand, 4 percent in Latin and Central America, 2 percent in Africa, and 7 percent in other countries. As smallholders produce 30 percent of global CPO, the total value of CPO they might have generated in 2020 is approximately USD 17 billion (Figure 2, column “Net Value”).
The large palm oil plantation groups manage much larger areas of oil palm, and they often source additional raw material from smallholders to feed into their mills. This group consists of companies which are privately owned or publicly listed, sometimes with governments owning shares. Large plantations are for instance Astra Agro Lestari, First Resources, Genting Plantations, Bumitama, Eagle High Plantations, London Sumatra Indonesia, and Socfinaf (no data available). Excluding Socfinaf, in 2020, this group realized in total USD 3.6 billion in net revenues (Bloomberg), which included other activities such as timber and rubber. If the gross margin and the operating margin of every company are applied for each company’s CPO output, the generated palm oil value for the group would be USD 3.9 billion, with the gross profit at USD 1.0 billion and the operating profit at USD 661 million (Figure 2).
The mid-level group often lacks financial transparency. These individuals or private companies own concessions, but they are not very large, particularly in Sumatra. They are included in the “rest of plantations” (Figure 2).
Integrated and diversified companies such as Wilmar can be huge
A group of other companies has integrated palm activities, including operations at mills and refineries, global trade, and consumer product development. These companies often have a larger landbank than the large 100 percent plantation companies. Wilmar International’s global processing and merchandising of palm and lauric oils with distribution network in more than 50 countries handled 25.6 MT in 2019. This suggests that Wilmar was involved in 30 percent of the global volume of embedded palm oil. Other companies in this group include Sime Darby, Golden Agri Resources, FGV, Salim Ivomas Pratama, KLK, and IOI. In 2020, these seven companies generated total revenues of USD 70.6 billion, a total gross profit of USD 8.7 billion and an operating profit of USD 3.8 billion (based on data from Bloomberg). In Figure 2, the calculation on embedded palm oil is only applied to the volumes in their plantation activities. Applying the earlier used gross and operating margin methodology per company, the total value generated from embedded CPO was USD 10.3 billion, while gross profit was USD 1.5 billion and operating income USD 851 million.
For the rest of the companies, which consist of smaller industrial plantations mainly, the average margins of all 13 large plantation companies are applied. Note that the pricing up column represents how plantations elevate the price of all their cost of goods sold to achieve the CPO price (of USD 754/MT).
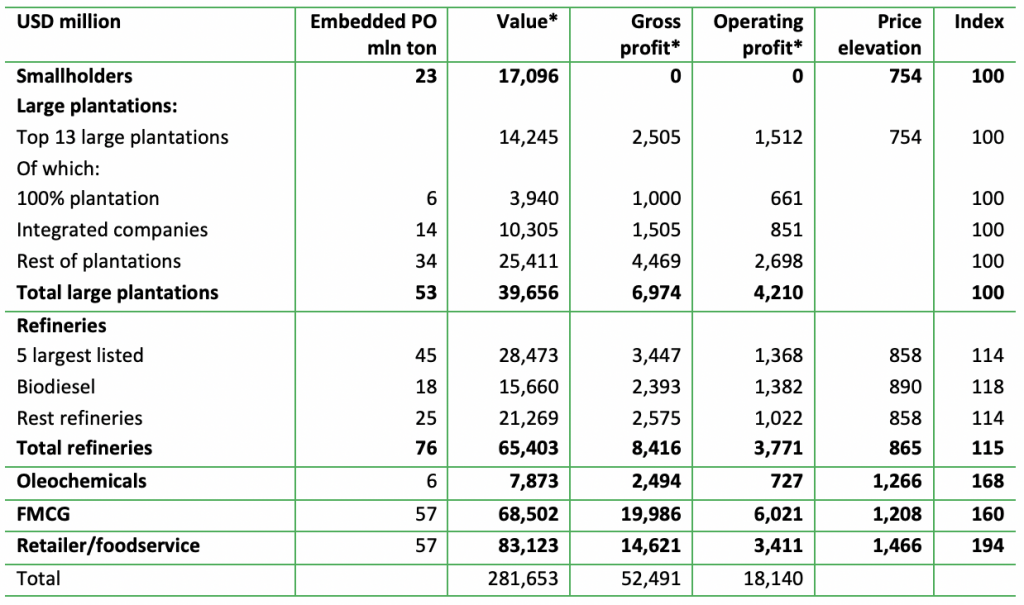
Figure 2: Smallholders and large plantations: embedded palm oil financials
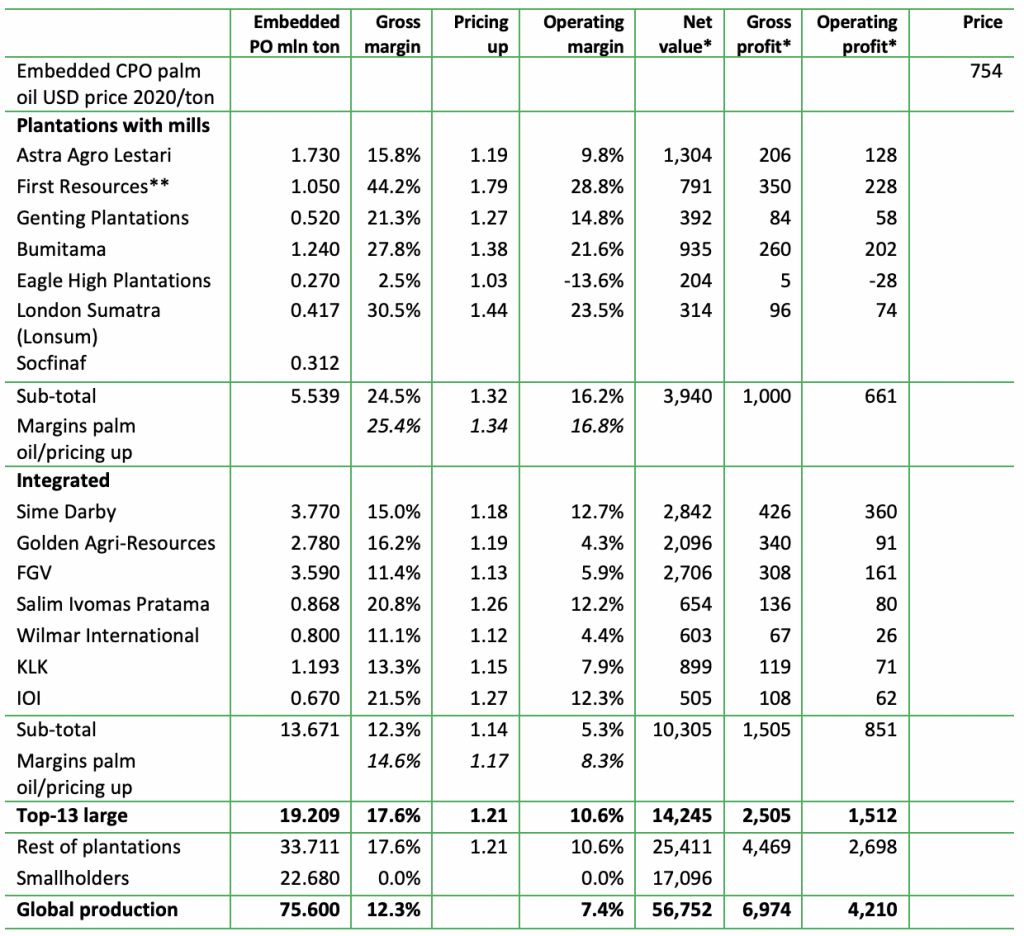
Source: Chain Reaction Research; annual reports, Bloomberg. PO = palm oil; * of (embedded) palm oil. ** First Resources also owns refining business, but this does not impact the list of top players or the profit chain calculations.
Palm oil refineries: A relatively consolidated part in the palm oil supply chain
The palm oil supply chain has the shape of an hour glass. A few dozen refineries source from thousands of palm oil mills and in turn supply a vast number of fast-moving consumer good (FMCG) companies and oil & gas companies. The refineries’ function is to convert CPO and other palm ingredients into refined ingredients for clients in the food, home and personal care, cosmetics, industrial (oleochemical, pharmaceutical), and fuel industries. Most refiners largely depend on supplies from third-party oil palm growers.
The largest palm oil refineries for mainly non-fuel customers are owned by Wilmar International, Musim Mas, Golden Agri-Resources, Royal Golden Eagle, Mewah International, FGV Holdings, and Sime Darby. Their total capacity is 45 million MT, which makes up half of the global market. The 2020 gross margin of the leading group on embedded palm oil (12.1 percent), pricing up ratio (1.14x), and operating margin (4.8 percent) result in USD 28.5 billion of embedded palm oil value, USD 3.4 billion in gross profit, and USD 1.4 billion in operating profit. These margins and ratio are also applied to the other smaller refineries. Biofuel refineries are analyzed in the next section.
Figure 3: Refineries and biofuel refineries: Embedded palm oil financials
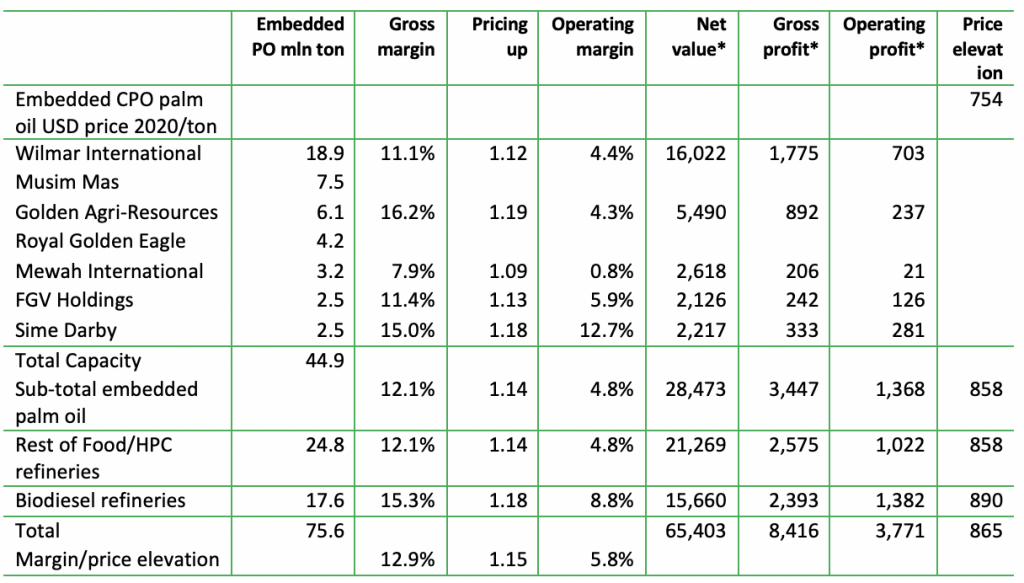
Source: Chain Reaction Research; annual reports, Bloomberg. PO = palm oil. * of (embedded) palm oil.
Biodiesel refineries use 23 percent of all palm oil, with large presence in Asia
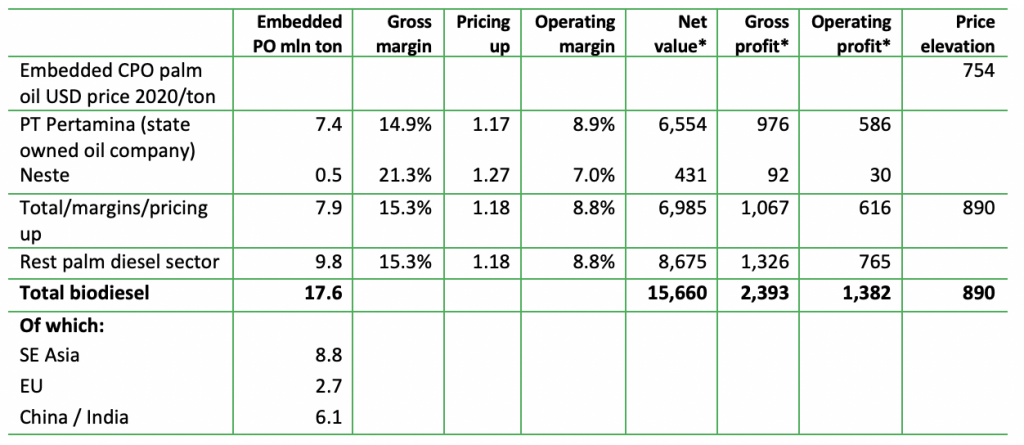
In 2019, 17.6 million MT of palm oil were used in biodiesel, which equals 23 percent of the global production of palm oil. Within biodiesel, palm oil is still the largest component globally with 39 percent, ahead of soybean oil, which accounts for 25 percent. In Southeast Asia (Indonesia, Malaysia, Singapore, Thailand), approximately 8.9 million MT of biodiesel are produced, most of which is palm oil-based. Thus, 50 percent of the palm oil used for biodiesel is refined outside Southeast Asia. China and India are two major markets for biodiesel, while the EU still imports approximately 2.7 million MT of palm oil for biodiesel or other fuels.
EU dominates global biodiesel production, but Southeast Asia is the main producer of palm oil-based biodiesel. The EU accounts for more than one- third of world biodiesel production (partly palm-based) and is also the single most important biodiesel producer, with a share of 34 percent of the global output in 2018. In the EU, rapeseed oil is a crucial input, and, in the United States, soybean oil is the main ingredient. Meanwhile, the Southeast Asian region has gained increasing importance in the biodiesel market. In the key palm oil-producing countries, Indonesia and Malaysia, biodiesel production is steadily rising, driven by increasing production of domestic palm oil. Contrary to the EU, these countries have raised their domestic blending quota requirements (Indonesia: B20/B30) to stabilize palm oil prices for producers and reduce foreign exchange expenses on oil imports. In the EU, palm oil has been introduced as a blend with fossil fuels for environmental reasons, but the EU will stop using palm oil in 2030 due to the impact on deforestation. Several countries will phase-out using palm oil as fuel earlier: France, Austria, and the Netherlands will do so in 2022 and Germany in 2026.
The Indonesian government owns oil company PT Pertamina, which is a leading biofuel refiner. Indonesia had planned to proceed with plans to raise the bio content of its palm oil-based biodiesel to 40 percent in 2021. However, because of funding problems, Indonesia will retain its biodiesel B30 program, which makes it compulsory for diesel in Indonesia to be blended with 30 percent fatty acid methyl ester (FAME). The dominant palm oil producer is PT Pertamina. PT Pertamina holds at least 80 percent of Indonesia’s biodiesel market and plans to boost output by another 15 percent before 2024. Pertamina produced 24.7 million kiloliters of B30 last year at 28 sites, which accounts for nearly half its total fuel output in 2020, including petroleum-based products like gasoline. Thus, the company used 7.4 million MT palm oil, which is 10 percent of global palm oil production. European company Neste sources 0.45 million MT of palm oil for renewable energy sources. Including derivatives and fractions (PFAD), Neste’s exposure to palm might be much larger. The weighted average of the gross margin of PT Pertamina and Neste on embedded palm oil is 15.3 percent, and the price elevation is 18 percent. The operating margin is 8.8 percent. By applying these multiples to all biodiesel refineries, the embedded value is USD 15.7 billion, while gross profit is USD 2.4 billion and operating profit on the embedded palm oil is USD 1.4 billion.
Figure 4: Biofuel refineries: Embedded palm oil financials
Source: Chain Reaction Research; annual reports, Bloomberg. PO = palm oil. * of (embedded) palm oil.
Oleochemical companies realize a 46 percent price premium on embedded palm oil
Like FMCGs, oleochemical companies source refined palm oil as well as PKO. The largest application for oleochemicals, a group of various fatty acid-containing compounds, is for making soaps, detergents, surfactants, paints, varnishes, lubricants, copolymers, and pharmaceutical aids. This industry benefits from palm oil’s renewable characteristics, which is in contrast to fossil fuels. The global oleochemicals market size was valued at USD 27.2 billion in 2019. The industry sources palm oil as well as other vegetable oils and animal fats. The oleochemical industry accounts for approximately 8 percent of all global palm oil and 70 percent of all PKO.
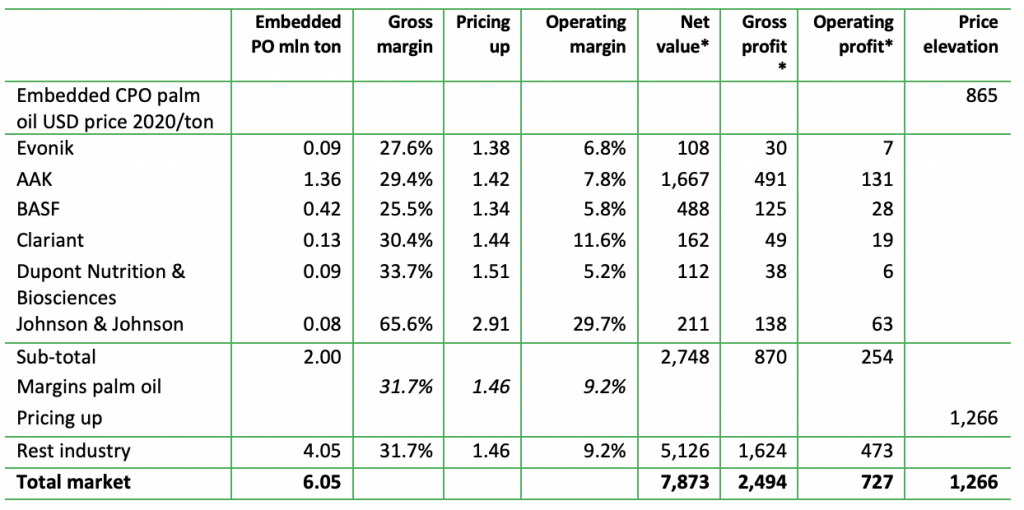
Companies active in oleochemical products include Emery Oleochemicals Group, BASF, Oleon NV, Procter & Gamble, Vantage Specialty Chemicals Inc, AkzoNobel, Kuala Lumpur Kepong Berhad, ADM, Kao, Evonik Industries AG, IOI Group, AAK AB, Croda International, and Cargill. For instance, Evonik says it sources 90,000 MT of CPO/KPO and derivates. AAK processes palm oil into food ingredients but also into oleochemicals and is therefore included in this sub-section. Johnson & Johnson and Dupont are included as pharmaceutical (ingredient) suppliers (see Figure 5).
In total, 6.1 million MT of palm oil are embedded in the oleochemical industry. The embedded palm oil value is USD 7.9 billion, and the embedded gross profit respectively operating profit is USD 2.5 billion and USD 727 million. The price premium (= elevation of the input price) is 46 percent.
Figure 5: Oleochemical industry: Embedded palm oil financials
Source: Chain Reaction Research; annual reports, Bloomberg. PO = palm oil. * of (embedded) palm oil.
Food companies/Home and Personal Care companies: Fragmentation with high margins
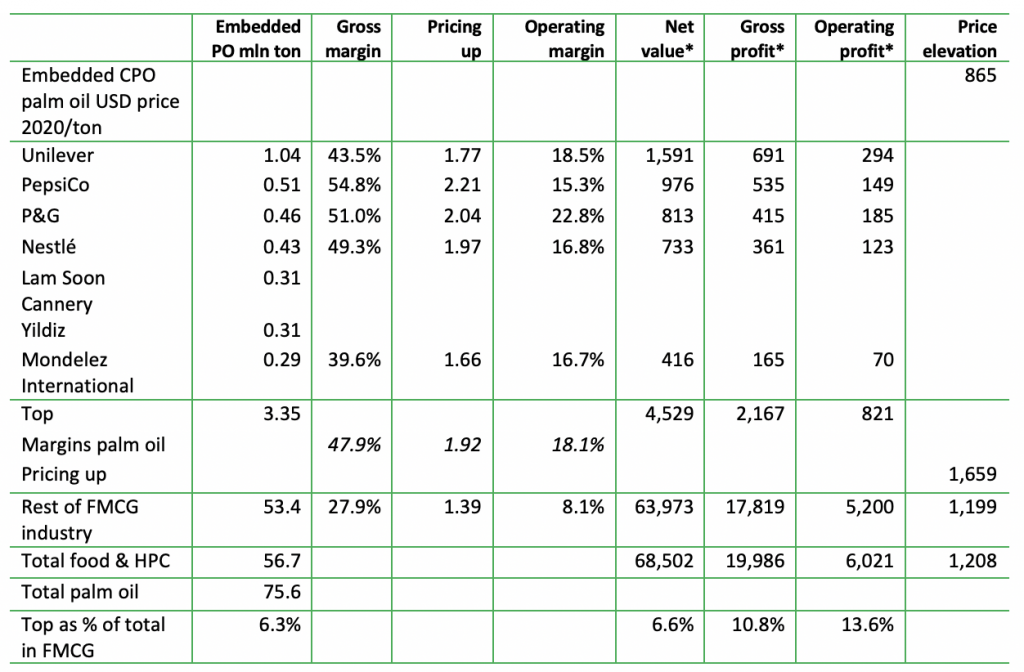
A major part of refined palm oil and PKO is processed by the food industry, leading to an embedded palm oil value of USD 69 billion, a gross profit of USD 20 billion, and an operating profit of USD 6 billion. Palm oil-based products might be in the form of cooking oil but often palm oil is embedded in other products. Also, the home and personal care companies are embedding palm oil into their products such as detergents, shampoos, skin care. The top 25 FMCGs have embedded 9 percent of total palm oil production.
An analysis of the top 5 palm oil-sourcing companies (Unilever, PepsiCo, Procter & Gamble, Nestlé and Mondelez) shows a price elevation of the embedded palm oil input price of 92 percent due to their high gross margin. These FMCGs are specialized in marketing global brands, which can generate premium pricing as well as efficient production. The operating margin of this selective group is 18.1 percent (weighted for embedded palm oil). This top-5 group accounts for 6.3 percent of total palm oil used by FMCGs and generates 10.8 percent of gross profit and 13.6 percent of operating profit. This characterizes the high fragmentation of the sector.
As food and HPC products use 75 percent of palm oil production, the global FMCG industry’s palm oil uptake is 56.7 million MT. A large part of FMCGs likely do not generate the same margins as the top-5 group as some make products with comparatively little value-add, such as cooking oil and simple margarines. The assumption is that their gross margins and operating margins are well below the top group, or 28 percent and 8 percent respectively.
Figure 6: Fast-Moving Consumer Goods industry: Embedded palm oil financials
Source: Chain Reaction Research; annual reports, Bloomberg, WWF Palm Oil Scorecard. PO = palm oil. * of (embedded) palm oil.
Supermarkets/retail and foodservice: A fragmented landscape
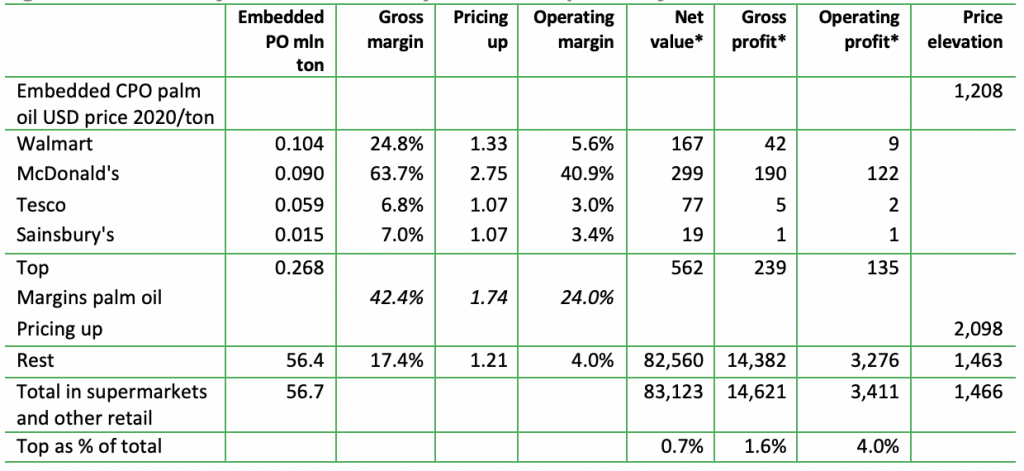
In total, the retail and foodservice group earns significant value on embedded palm oil, but the top four contribute only 1-4 percent. FMCGs sell their products to supermarkets and foodservice. Globally, this is a fragmented group and particularly in the supermarket segments, cross-border consolidation is still limited. Moreover, within a single country, the retail outlet structure can vary from large (Walmart) to small (mom-and-pop stores).
The embedded palm oil market totals 56.7 million MT. Individual retailers might under-estimate their volumes of embedded palm oil as the retailers’ departments responsible for data-gathering might not have reached 100 percent data collection, product transparency, and traceability. On the one hand, the gross margins for top retailers are negatively affected by UK retailers. Their published gross margin is relatively low as they include many other cost items in the item cost of goods sold (COGS). On the other hand, McDonald’s distorts the outcome of the top four to the upside. As the calculation in Figure 7 is dominated by the remaining retail landscape, a gross margin assumption of 17 percent is realistic for the whole industry. The top four retailers generate USD 562 million in embedded palm oil value and USD 239 million in gross profit. On a global scale, CRR estimates that retailers and food service companies generate a value of USD 83 billion and USD 15 billion respectively in gross profit on embedded palm oil.
Figure 7: Retail and foodservice industry: Embedded palm oil financials
Source: Chain Reaction Research; annual reports, Bloomberg, WWF Palm Oil Scorecard. PO = palm oil. * of (embedded) palm oil.
Distribution of value and profit in the top 11 companies
The embedded palm oil supply chain generates a total value of USD 282 billion, USD 52 billion of gross profit, and USD 18 billion of operating profit. Figure 8 summarizes the preceding outcomes. Retailers generate the largest value (USD 83 billion) in embedded palm oil. The FMCG sector generate the largest gross profit at USD 20.0 billion and an operating profit of USD 6.0 billion. Throughout the whole chain, the price elevation of embedded palm oil is nearly 100 percent (index 194).
Figure 8: Value and profit generation in the palm oil chain
Source: Chain Reaction Research; annual reports, Bloomberg. PO = palm oil. * of (embedded) palm oil.
Sixty-six Percent of the gross profits on embedded palm oil is generated in the downstream sectors, which consist of FMCGs and retailers. In operating profit, the downstream contribution is 52 percent. While the gross profit contribution of plantations is limited, their contribution to operating profit is 23.2 percent. Refineries in total generate 16 percent in gross profit and one-fifth of the operating profit in the global embedded palm oil chain.
Figure 9: Percentage distribution of value and profit generated in the palm oil chain
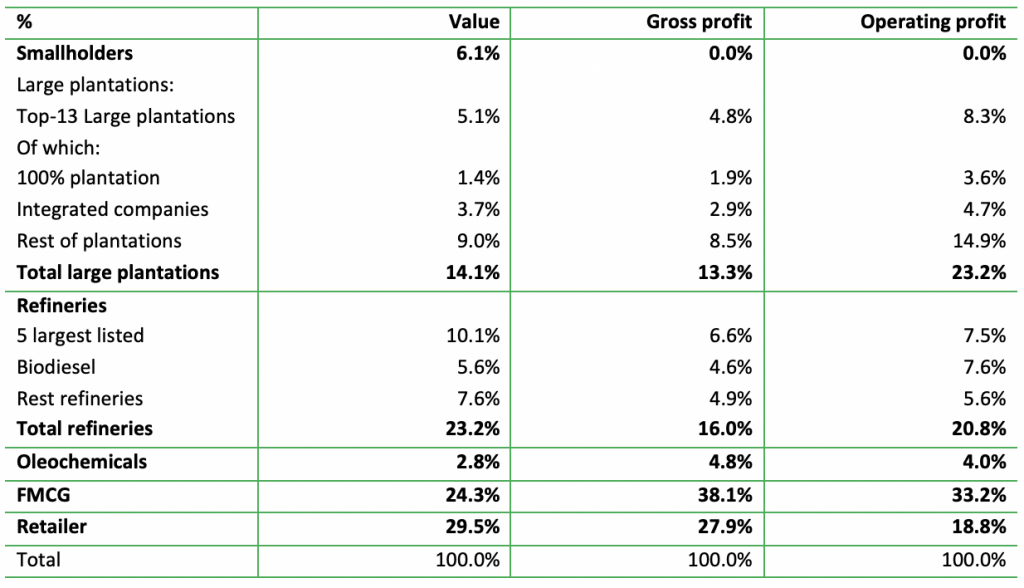
Source: Chain Reaction Research; annual reports, Bloomberg.
Figure 10: Overview of gross profit distribution in the palm oil chain
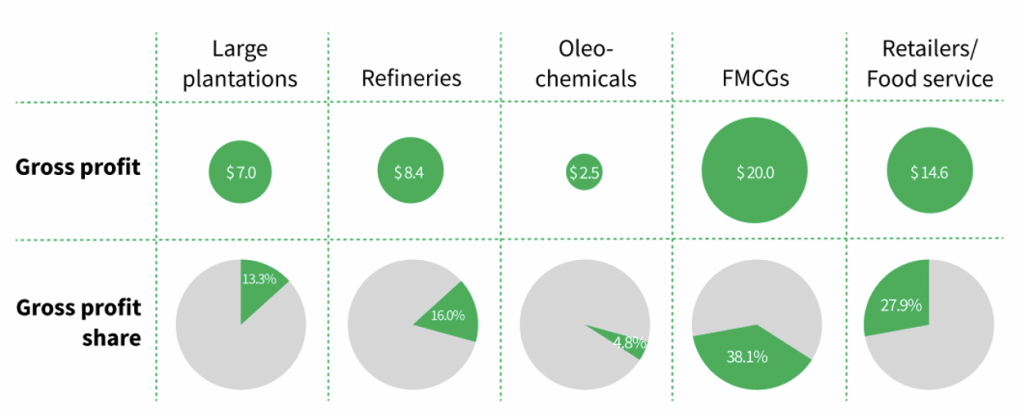
Source: See Figure 9. Note: In billion USD
The top 11 value and profit generating companies in the palm oil chain process 51 percent of global palm oil. Wilmar International, which is active in plantation, milling, refining, and trading, is the largest company, and PT Pertamina (Indonesian energy company) is the second. FMCGs are well represented in the list. Although retailers take a large part of the profit in the chain, the first retailer on the list in 11th place, largely due to fragmentation of this market.
The volume contribution of the top 11 palm oil value chain companies (51 percent of global palm oil) is much larger than the gross and operating profit contribution. This is mainly because Wilmar, Sime Darby, Golden Agri, Astra Agro Lestari, and Pertamina (plantations and refiners) realize relatively low gross profit and operating profit per ton.
Figure 11: Top 11 companies in the palm oil value and profit chain, ranked by gross profit
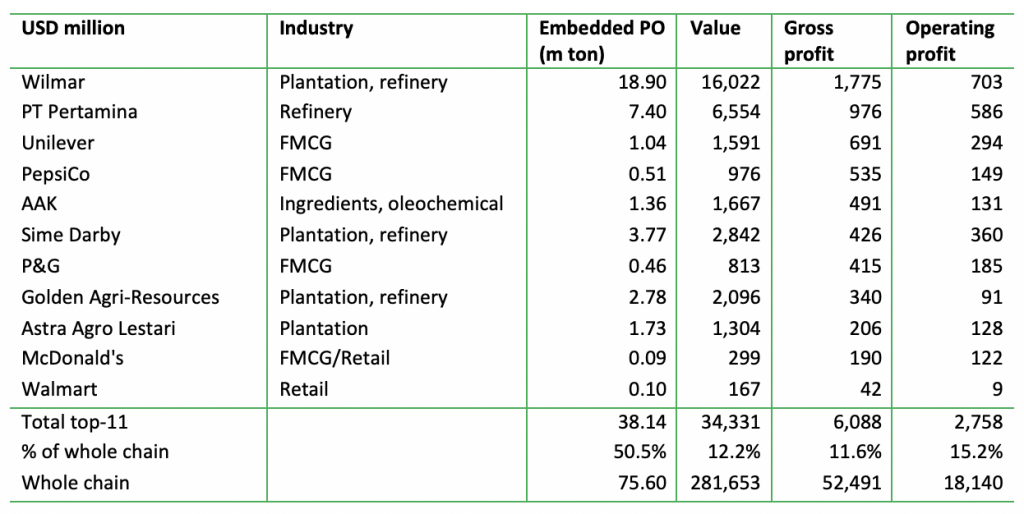
Source: Chain Reaction Research; annual reports, Bloomberg. PO = palm oil.
FMCGs require 1.8 percent price increase to make palm oil sustainable
FMCGs would require, on average, a 1.8 percent price increase on products containing palm oil in order to finance all costs to make them nearly free of deforestation. The FMCG and retail sectors generate most value in the palm oil chain. These sectors contain listed companies with a high value on the stock market, and banks and bondholders might be large financers. Consequently, if the palm oil used in their products is linked to deforestation, these stakeholders face financial risks.
Deforestation and peatland transformation to palm oil areas occur on large plantations and through smallholders. Smallholders are often confronted with poverty and lack resources to fund the replanting of existing areas. Due to aging palm trees, large resources are needed in the coming 25 years to pay for a “smooth” renewal program without deforestation. These costs include new trees and temporary loss of cash flow until trees planted on existing land reach maturity after 3-4 years. For the whole palm oil industry, the planting costs and loss of cash flow total USD 9,163 per hectare and would come to USD 28 billion for the 3.1 million independent smallholders’ hectares in the upcoming 25 years. The amount needed would be USD 1.1 billion per year.
On top of this, NDPE execution, verification, and monitoring costs are needed for a sustainable supply chain. The best-in-class outcome leads to approximately USD 65 per ton for (embedded) palm oil. With a total of 75.6 million MT of palm oil, total scrutiny costs would amount USD 4.9 billion (see Figure 12). With new technology applications (block chain, satellite, etc), consolidation in plantation sector, as well as consolidation in sourcing, material efficiencies can likely be achieved. In total, replanting, cash flow gap, and full verification would cost USD 6.0 billion per year.
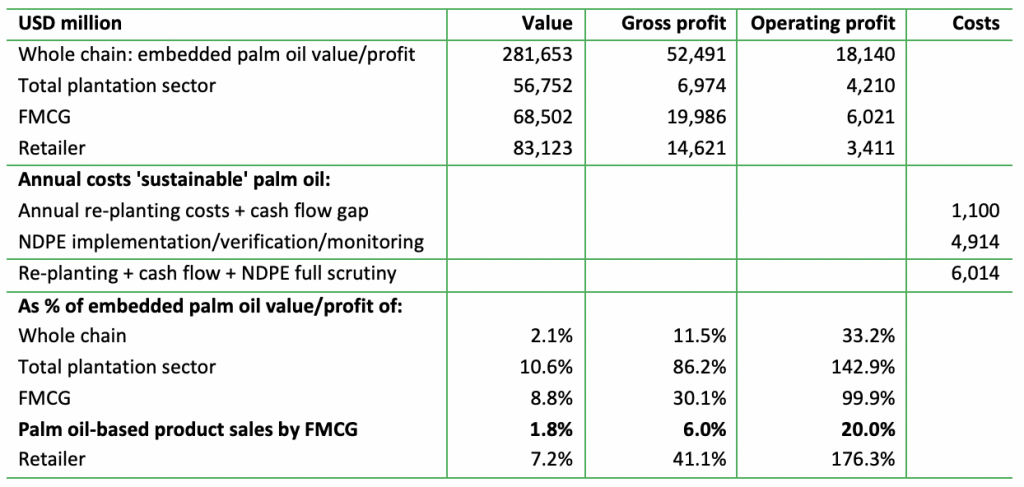
Of the value generated in the entire palm oil chain, these total costs of creating “sustainable” palm oil would represent 2.1 percent (Figure 12) of the embedded palm oil value, 11.5 percent of all embedded palm oil gross profit in the chain, and 33 percent of operating profit. If the plantation sector would bear all of the costs, the operating profit on embedded palm oil, which is a major part of their business, would be affected by more than 100 percent.
For FMCGs and retailers the percentages are respectively 100 percent and 176 percent of operating profit generated on embedded palm oil. However, for instance Procter & Gamble enabled the calculation that palm oil costs account for only 4.0 percent of raw material costs of palm oil-related products. KAO (Japan) had an outcome of 10.5 percent. For many FMCGs producing cooking oil based on palm oil, the percentage would be higher. Assuming the global outcome is 20 percent, on average FMCGs would need to raise prices of palm oil-based products by 1.8 percent if only FMCGs pay for the whole transition.
These numbers may appear high and could lead to the industry being reluctant to change the current status. However, FMCGs with strong brands and high margins would see nearly no impact. Procter & Gamble would require a price increase of 0.15 percent for products containing palm oil. KAO (Japan) would require a 0.25 percent price increase. For both, only the NDPE implementation, verification, monitoring, which are responsible for the largest part, 82 percent, of the costs, are taken into account.
Figure 12: Embedded palm oil value and profits versus cost of “sustainable” palm oil
Source: Chain Reaction Research; annual reports, Bloomberg. PO = palm oil.
Appendix: Methodology
For several key players in the sub-sectors — palm oil plantation, palm oil refineries, animal feed, food processing, food retail, and biofuels — estimates of turnover and profit linked to palm oil volumes have been calculated. These calculations draw on the companies’ annual reports and segment numbers given in these reports. The global palm oil production is approximately 76 million MT, and the leading key companies in each part of the supply chain are seen as representative for the other companies in the same part of the supply chain. When the leading companies are significantly different than the smaller companies on that level in the chain, a correction is made and explained in that section.
For each of the key players, the volume of the processed or embedded palm oil used in their businesses is the starting point for the calculations. This approach means that the processed palm oil has a different price in each level of the chain:
- There could be a price elevation of the smallholder and farmer to the miller, often owned by a larger plantation. However, the structure of the industry likely means this is small or absent. The assumption is that both will receive the global crude palm oil price per ton.
- Subsequently, the larger plantation is selling the product with a premium to the palm oil refinery, which can in some cases be the same company, such as with Wilmar. “Refineries” also include biofuel refineries.
- Through adding value, the refinery elevates the price of embedded palm oil further to the food processing, HPC (FMCG industry), pharmaceutical and ingredient companies as well as to the oleochemical industry.
- These companies further process the embedded palm oil and elevate the price to the supermarkets.
The logic is that every part of the supply chain adds value to the specific volume of embedded palm oil. The elevation premiums vary per each step in the supply chain. They are relatively limited in a commodity type environment (trading, farming) with heavy competition (farming) and are larger in consolidated parts (food products with strong brand) of the market with less competition.